Reliable 5G waveform detection from an optical fibre transmitter system
- Department of Medical Device Technology Engineering, Al Mustaqbal University, Babylon, Iraq
- Department of Electrical and Electronic Engineering, Faculty of Engineering, University Putra Malaysia,Serdang 43400, Selangor, Malaysia
Article Info
Received 02 Oct. 2023
Received in revised form 27 Nov 2023
Accepted 12 Dec. 2023
Available on-line 17 Jan. 2024
Keywords: Optical fibre; 5G; NOMA; hybrid technique; cognitive radio CR; probability of detection; SNR.
Abstract
The integration of optical fibre communication with multiple input multiple output-non-orthogonal multiple access (MIMO-NOMA) waveforms in cognitive radio (CR) systems is examined in this study. The proposed system leverages the advantages of optical fibre, including high bandwidth and immunity to electromagnetic interference to facilitate the transmission and reception of MIMO-NOMA signals in a CR environment. Moreover, MIMO-NOMA signal was detected and analysed by the hybrid-discrete cosine transform-Welch (H-DCT-W) method. Based on the modes results, a detection probability greater than 0.96%, a false alarm probability equal to 0.06, and a global system error probability equal to 0.09% were obtained with a signal-to-noise ratio (SNR) less than 0 dB, while maintaining a simple level of complexity. The results obtained in this paper indicate the potential of the optical fibre-based MIMO-NOMA system based on H-DCT-W technology in CR networks. Therefore, its suitability for practical CR applications is demonstrated by the improvements obtained in false alarms, detection probability, and error rates at low levels of SNR. This study contributes to the development of efficient and reliable wireless communication systems by linking cooperation and synergy concerning MIMO-NOMA, optical fibres, as well as the proposed detection technique (H-DCT-W).
Introduction
Usually, the signal transmitted over an optical fibre remains within the fibre for the entire communication link, i.e., from the beginning to the end. Optical fibres carry the signal to a central point, which is called a central office (CO) or information centre [1] where many optical fibres converge. Thus, this is a central axis at the central point (CO/Information Centre) where the optical signal is converted into an electrical signal. The data that must be transmitted wirelessly is contained in an electrical signal [2]. Then, via a wired connection, the base station (BS) receives the transmitted electrical signal. In the coverage area, the BS connects directly to mobile devices, so the BS is a crucial component in wireless networks and is equipped with antennas and transceivers, which convert the electrical signal into radio waves. To provide wireless coverage for mobile devices, these radio waves are sent into the air and these devices such as smartphones, tablets, and laptop computers are within their range [3].
The use of opto-electronic modules and radio frequency (RF) tools to convert the signal from optical fibre to the air is provided by the BS [4] using a device called a photodetector or a photodiode. The optical signal that passes from the begin-ning to the end of the optical distance through the optical fibre to the BS is converted into an electrical signal. The incoming light signal is then detected through the photodiode and generates an electrical voltage proportional to the light intensity. Until the signal is prepared for transmission over the air, it includes several processors (filtering, amplification, and conditioning). The electrical signal is sent on an RF carrier wave. It is then processed and modified significantly [5–8]. The RF signal that carries the original information is produced after the high-frequency RF signal is mixed with the electrical signal. The RF signal is then fed into the BS that carries the original information to an antenna, where the antenna radiates that signal in the form of electromagnetic waves [9, 10].
The information originally encoded in the optical signal is propagated wirelessly through the air by the RF signal. This signal is then received, demodulated, and returned to its original electrical form by mobile devices, within the coverage area of the BS. These devices contain RF receivers and demodulators, especially for those circuits, devices such as handheld gaming consoles, tablets, smart watches, laptop computers, e-readers, and smartphones [11, 12]. Here, it can be said that the BS works as a bridge between the fibre optic network and the wireless communication network, as devices within the coverage receive the RF signal and demodulate it to extract the electrical signal, after which those devices process it to recover the data or content that is being sent [13–15] which allows for easy communication between wireless and wired devices in the cellular network. The BS converts optical signals into RF signals. It plays an important role in wireless transmission and vice versa. Therefore, optical fibres work to transmit high-speed data over long distances. They act as the backbone. In this scenario, the BS plays a crucial role in converting the signal from fibre into radio waves for wireless communication with mobile devices within the coverage area.
It is important when 5G signals are transmitted through this system. It is necessary to detect and analyse these signals to ensure optimal network performance and to fix the problems that have been discovered. At the endpoint of any fibre optic transmission system, specialised equipment is required to convert optical signals back into electrical signals that can be processed [16–18]. Always in 5G, a high signal-to-noise ratio (SNR) indicates that the current signal strength is much higher than the noise strength. This results in good system performance, excellent signal quality, and reliability. However, when the SNR ratio is low, it means that the noise strength is comparable to the signal strength or even higher. This leads to damage the 5G signal received by the noise. In this case, it leads to errors in data transmission and reduces signal quality [19–21]. As the SNR increases, it expands the coverage and range of 5G signals, and conversely, a decrease in the SNR leads to packet loss and increased latency [22, 23]. The advantage of the particularly high SNR for 5G frequencies is that, with limited propagation range, the signal can reach longer distances before it becomes too weak to be reliably detected.
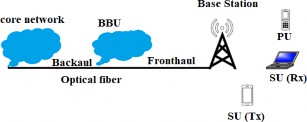
A communication system using 5G technology and cognitive radio (CR) has been created to improve spectrum usage using a spectrum sensing (SS) algorithm [24, 25]. The proposed SS algorithm is a hybrid-discrete cosine transform-Welch (H-DCT-W) technique, consisting of a discrete cosine transform (DCT) that uses the Welch technique to perform segmentation after filtering the traffic signal. The 5G waveform typically originates from a data centre or backbone network, where it is digitally generated [26]. The RF signal is then passed to the radio equipment, which includes antennas and amplifiers. The RF signal is transmitted through antennas. These antennas are designed to focus and direct the radio waves in the desired direction, providing coverage to a specific area or cell. Once the RF signal is transmitted through the antennas, it propagates through the air as electromagnetic waves [27–30]. These waves carry the 5G signal to mobile devices within the cell coverage area as shown in Fig. 1.

Methodology
Businesses and researchers have shown significant interest in the capabilities of 5G systems. In a previous study [31], a novel hopping discrete Fourier transform (HDFT)-based frequency spreading filter bank multi carrier (FS-FBMC) design was proposed, aiming to reduce complexity from a high to a moderate level for FS receivers. However, this approach faced challenges related to complexity management and was not entirely successful.
In 2019, the authors have made extensive efforts to reduce the computational complexity of this filtered-orthogonal frequency division multiplexing (F-OFDM) system. The limitations on the length of the F-OFDM filter have been removed, but it still represents an important computational complexity. Furthermore, this method did not acceptably and successfully address complexity matters through different 5G schemes, and the system continued to suffer from a high computational complexity degree [32]. In the same year of 2019, researchers developed an error probability-based antenna documentation method for resource block-filtered-orthogonal frequency division multiplexing (RB-F-OFDM) networks to decrease the computational complexity [33].
On the other hand, this method challenged difficulties in dealing with reducing the high levels of complexity despite the new technology and did not provide a comprehensive solution for all 5G considerations, and the system continued to suffer from a high rate of complexity. In the same year, the authors obtained results from an evaluation of wireless FBMC networks with fewer subcarriers. The results of this method displayed a significant performance improvement over OFDM networks in terms of bit error rate (BER) and access time, but the system still suffered from a high computa-tional complexity rate [34]. Furthermore, researchers have assessed the complexity levels of various universal filtered multi-carrier (UFMC)-dependent methods that contain featherweight systems including finite impulse response (FIR) and poly phase filters [35], but have nevertheless been unable to address the matters of computational complexity and how to reduce the computation complexity levels. In 2020, the authors identified a novel approach to selective mapping (SLM), leveraging the linear characteristics of the UFMC modulation modulator. This method succeeded in reducing a very high computational complexity to a lower level [36].
Previous methods discussed in the cited works were observed to realise their benefits and limitations. Dealing with low SNR has been one of the challenges encountered in SS, and most of these methods express high levels of complexity associated with computational tasks. After evaluating these methods, the authors concluded that they did not provide effective solutions for managing compu-tational complexity. Considering these results, the authors propose a new technique designed to operate at lower complexity levels and lower SNR values, known as the hybrid technique (H-DCT-W). In this study, the authors present a new cognitive radio network (CRN)-based sensing method to differentiate between different 5G waveforms without requiring high computational complexity. The hybrid technique removes the obligation for prior information about the primary user. The essential values of this method include considering system error and false alarm probability, finding an SNR threshold, and assessing the probability of detection rate. In this spectrum sensing framework, cosine filters are used to blindly evaluate spectral bands, effectively distinguishing between traffic signals and noise.
Motivations and key contributions
This research is motivated by several critical challenges in wireless systems:
-
Boundaries of CR nets in 5G: Growing absence of CR networks integrated into terrestrial 5G systems capable of detecting a wide range of waveform types.
-
Rare spectrum foundations: Wireless spectrum remains a limited resource in wireless communications systems. Their scarcity requires more real organisation to meet the increasing demands of wireless communications.
-
Levels of complexity: The high complexity associated with CR-5G systems presents significant obstacles.
-
Signal detection at low SNR is a challenge: Accurate signal detection becomes a problem, especially in scenarios with low SNR, which leads to poor signal detection performance in the system.
Through the goal of enhancing system performance efficiency and excellence, the chief contribution of this study is to address these challenges:
-
Enhancing good waveform (UFMC) detection, addressing the challenges posed by low SNR and waveform diversity is a key goal to allow extra robust and precise waveform detection. The method searches to increase the detection abilities of CR networks in the framework of 5G waveforms.
-
In treating the degree of high information, this is a research attention on accommodating high-rate data transmission besides reception in CR-5G systems.
These factors lead to ongoing challenges related to spectrum scarcity, difficulties in detecting UFMC signals with low SNR, limited CR capabilities in 5G systems, and high computational complexity of the system. Therefore, major contributions have been made to enabling high-information rate communications, improving spectrum sensing techniques, and enhancing waveform detection. This work aims to increase system efficiency and high-performance reliability in 5G systems.
The suggested typical 5G environment
The proposed technique involves many stages, including a DCT stage and a Welch segmentation stage, to success-fully differentiate between 5G traffic and noise. The process is explained in detail below:
-
DCT stage: In this stage, the DCT technique is used to highlight the basic features of the waveform. It focuses on the true fundamentals of the signal, using a smaller number of samples. Focusing on real bases with fewer samples is crucial for the subsequent analysis. Real bases with fewer samples play a pivotal role in this distinction. This technology uses cosine filtering to separate the 5G traffic signal from the noise.
-
Welch segmentation: Filtered signals undergo Welch segmentation, which reduces noise variance and improves signal excellence. Welch segmentation divides the new sample set into smaller segments and computes their averages. The result is a single analogue value for each segment, which effectively mitigates the outcome of noise, as shown in Fig. 2.
-
Calculating the average signal length: After segmen-tation, the method includes performing mathematical operations such as addition and division. These operations use addition and division to obtain the rate ratio that compares with the threshold, as shown in Fig. 2.

Perhaps, an “idle” state shows that only noise exists inside the band. Although a “busy” state indicates the simultaneous presence of both noise and traffic in the bandwidth [37]. Consequently, the meaning of each hypothesis depends on its error rate, as detailed here:
\( P_f=P\left(\text { Decision }=H_1 \mid H_0\right) \) (1)
\( P_{m d}=P\left(\text { Decision }=H_0 \mid H_1\right) \) (2)
hence,
\( P_e=P_f+P_{m d} \) (3)
The probability of a false alarm (kind I error), denoted by 𝑃𝑓, continuously indicates the unpleasant sign of the primary user (PU) signal. On the other side, 𝑃𝑚d denotes the proba-bility of missing detection (kind II error), which indicates a precise sensing of PU signals. The universal error in the system is encoded with the symbol 𝑃𝑒. On the other hand, the balancing term for the missing detection probability is the detection probability, denoted by 𝑃𝑑 , as detailed here:
\( P_e=P_f+P_{m d} \) (4)
therefore,
\( P_{m d}+P_d=1 \) (5)
Energy detection technique through which a sensor waveform can be generated blind provides comprehensive information about the signal structure. The received power is compared to a certain limit 𝛾 calculated using noise measurements. The proposed spectrum sensor is used to consider the null and alternative hypotheses:
\( H_0 \text { : PU Absent } S[n]=w[n] \) (6)
\( H_1: \text { PU Present } S[n]=s[n]+w[n] \) (7)
Using the parameters of the transmitted signal, the hypothesis can be reformulated. The presented business idea assumes that the PU possesses a signal length PU denoted by 𝑁, and it further assumes that the sum of the squares of 𝑁 for Gaussian random variables is denoted by 𝐺. Consequently, the distribution of 𝐺 is approximated to be normal when 𝑁 exceeds 250, following the central limit theorem [38].
A receiver operating characteristic (ROC) curve is a graph showing the performance of a classification model at all classification thresholds This curve plots two para-meters: true positive rate (detection probabilities) and false positive rate (comprehensive false alarm). For M-secondary users, the ROC approach is relied upon for decision fusion
\( Q_f=1-\prod_{m=1}^M\left(1-P_f\right) \) (8)
\( Q_d=1-\prod_{m=1}^M\left(1-P_d\right) \) (9)
Here, 𝑄𝑓 and 𝑄𝑑 mean the universal probability values on behalf of false alarm and detection.
The mean and variance are computed as follows:
\( G-M\left(N\left(\left(\left(\sigma_w^2+\sigma_s^2\right)\right), 2 N\left(\left(\sigma_w^2+\sigma_s^2\right)\right)^2\right)\right) \text { under } H_1 \) (10)
Since this point forward, 𝐺 serves as the control statistic and needs to be matched to a predefined threshold, denoted as 𝜆D, exactly designed on behalf of the PU signal. The statistical definitions for the probability of false alarm (PFA) and probability of detection (PD) are shown as
\( \mathrm{PFA}=P_r\left(G>\lambda D ; H_0\right) \) (11)
\( \mathrm{PD}=P_r\left(G>\lambda D ; H_1\right) \) (12)
where PFA signifies the probability of a false alarm, which happens when 𝐺 exceeds 𝜆D under the hypothesis H0 (no PU signal). PD signifies the probability of detection, which occurs when 𝐺 exceeds 𝜆D below the hypothesis H1.
Here, using energy detection, the PFA can also be evaluated, so the expression for (13) can be as follows
\( P_f=\operatorname{Prob}\left\{\left(H_1 \backslash H_0\right)\right\}=Q\left(\frac{G-2 R-\sigma_w^2}{\sqrt{\frac{2 R}{M}}\left(\sigma_w^2\right)^2}\right) \) (13)
\( P_d=\operatorname{Prob}\left\{\left(H_0 \backslash H_1\right)\right\}=Q\left(\frac{G-2 R-\left(\sigma_w^2+\sigma_s^2\right)}{\sqrt{\frac{2 R}{M}}\left(\sigma_w^2+\sigma_s^2\right)^2}\right) \) (14)
The received NOMA wave can be represented as 𝑟[n], has a length denoted by 𝑉, and can be explained as follows:
\( \left\{s[n]=\begin{array}{ll} w[n] & H_0 \\ \{\operatorname{NOMA}[v]+w[n]\} & H_1 \end{array} \quad n=12, \ldots, n\right. \) (15)
whereever 𝑤[𝑣] indicates the Gaussian noise with zero mean and a 𝜎𝑤2
\( \begin{aligned} & R_{N O M A}[k]= \\ & (-1)^k \sum_{v=0}^{V-1} \sum_{b=0}^{B-1} \sum_{l=0}^{L-1} \sum_{n=0}^{N-1} s_n^b g[l] e^{j 2 \pi v \frac{(n-l)}{N}} / \sqrt{V}+ \\ & \sqrt{\frac{2}{V}} \sum_{v=0}^{V-1} \sum_{b=0}^{B-1} \sum_{l=0}^{L-1} \sum_{n=0}^{N-1} s_n^b g[l] e^{j 2 \pi v \frac{(n-l)}{N}} \cos \left(\frac{\pi k(2 v+1)}{2 V}\right), \\ & 0 \leq k \leq K-1 \end{aligned} \) (16)
which denotes the noise variance. This appearance is used to calculate the probability of false sign detection (𝐻1) when the real circumstance is not a sign at all (𝐻1).
Model outcomes
Here, the authors present the outcomes of simulations conducted with MathWorks®. A 5G waveform employing NOMA technology has been tested. The system perfor-mance across various SNR stages and below additive white Gaussian noise (AWGN) channel conditions has been evaluated, considering the parameters linked to the generated signals. Table 1 provides the instantaneous results of the NOMA waveform, as discussed in Refs. 39–41.
Table 1.
The paprameters of a 5G waveform (NOMA)..
NOMA |
Number of FFT = 1024 |
Number of resource blocks = 50 |
Number of sub-carriers = 12 |
Length of cyclic prefix = 88 |
Bits/sub-carrier = 4 |
Tone offset = 2.5 |
Length of filter = 513 |
In this context, the symbol R signifies the specific factor associated with NOMA. The mean power spectral densities (PSDs) are calculated as follows:
\( \operatorname{RPSD}=\frac{1}{N_{s e g}} \sum_{i=0}^{N_{s e g}-1} \operatorname{PSD}(i)=G \) (17)
Moreover, 𝑃𝑓 is determined by means of (13) because it depends on the original signal length and SNR.
\( P_f=\operatorname{Prob}\left\{\left(H_1 \backslash H_0\right)\right\}=Q\left(\frac{\eta-\sigma_w^2}{\sqrt{\frac{2}{M}} \sigma_w^2}\right) \) (18)
In this equation, 𝑃𝑓 signifies the false alarm probability, 𝑄 is the Q-function (related to the complementary cumulative distribution function of a standard normal distribution), G is the test statistic, R is the specific factor, 𝜎𝑤2 is the noise variance.
Conversely, 𝑃𝑑 is computed using the innovative distance metric: K' in the following manner:
\( P_d=Q\left(\frac{\eta-\vartheta\left(\frac{\sigma_s^2}{\sigma_w^2}+1\right)}{\sqrt{\left(\frac{2}{K^{\prime}}\right)} \vartheta\left(\frac{\sigma_s^2}{\sigma_w^2}+1\right)}\right) \) (19)
Monte Carlo simulations were conducted to validate the efficacy of the proposed SS system. The results obtained through simulations using MathWorks® and a 5G waveform filter are presented in Table 1. In this section, the influence of SNR on the received signals is presented. Our simulations involved the NOMA signal observed under varying SNR conditions. It became evident that SNR had a substantial effect on the network sensing capabilities due to its ability to alter signals across different categories. Fig. 3 shows the SNR values of 10 dBm, −30 dBm and −10 dBm. Three SNR values were used to generate PSDs of the received NOMA signals. Thus, at −30 dB SNR, the noise contrast was very high, especially when combined with the transmitted signals, while at 10 dB SNR, the noise was reduced to a minimum. As shown in Fig. 3, the received NOMA waveform shows a significant effect of a noise change on the PSD.
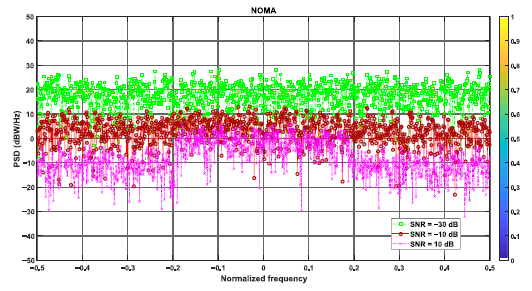
Thus, at 10 dB SNR, the NOMA signal showed a very low noise ratio when compared with the rest of the SNR values. At this point, it can be further explained that the SNR values affect traffic estimates, so this requires a strong and accurate standardisation. Fortunately, our proposed method solves this problem well by distinguishing between traffic and noise.
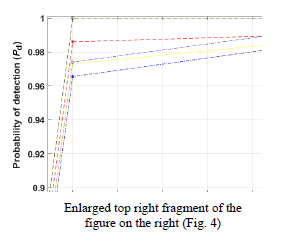
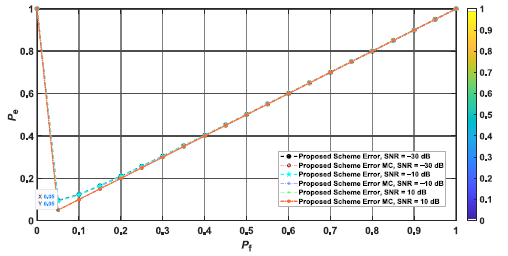
Given the extended signal inherent in the NOMA approach, it demonstrated superior signal detection capa-bilities when compared to the SS approach, as visualised in Fig. 4. The authors rigorously tested their simulation technique across various SNR values to assess the effec-tiveness of the proposed SS framework. The resulting detection probabilities, calculated at a 0.05 PFA, were as follows: 0.978 for −30 dB SNR, 0.986 for −10 dB SNR, and 0.991 for 10 dB SNR. These results indicate the robustness of our approach across a range of SNR condi-tions. Similar colours on the two curves indicate closely matched error probability rates between the two approaches.
Moreover, it is noteworthy that both simulated and mathematical frameworks exhibited comparable detection probabilities and surpassed traditional techniques in terms of performance.
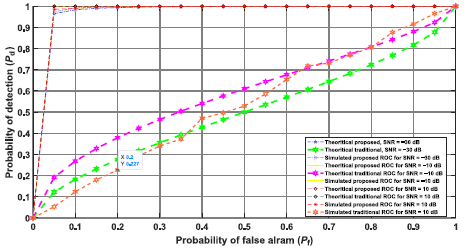
The traditional approach resulted in relatively higher error probabilities across the SNR values tested. Conversely, when the false alarm probability was fixed at 0.05, the error probabilities were as follows: 0.069 for −30 dB SNR, 0.062 for −10 dB SNR, and 0.061 for 10 dB SNR. Thus, at higher SNR values, the error probabilities were significantly lower. Notably, the suggested spectrum sensing method showed a commendable error rate probability of 0.069 for the challenging −30 dB SNR case. This underscores the superior signal detection accuracy achieved by the recommended SS framework, charac-terised by lower error rates, as shown in Fig. 5 and Fig. 6, in the case of a single-user and multi-user sequential use. Fig. 6 illustrates the error of the proposed system concerning multiple users. The data reveal a correlation wherein a higher number of users in the system corresponds to a lower error system rate. Specifically, at a user count of 45, the error system rate was exceptionally low (0.0066). Similarly, at a user count of 50, the error system rate stood at 0.0055, contrasting with a higher rate of 0.1235 when the user count was 15.
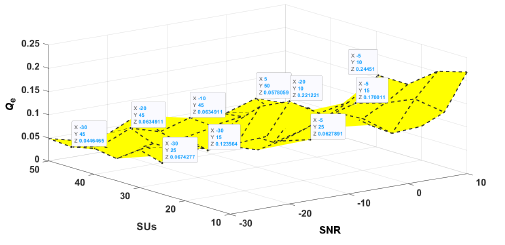
These findings underscore that an increase in the number of users within the system correlates with a decrease in the error system rate. To improve the performance of the wireless communi-cation link, multiple antennas (2 × 2) incorporating MIMO technology are used at both transmitter and receiver. It can provide multiplexing gains to improve data rate, reduce interference, and improve link quality, which can enhance the reliability and capacity of the communication system. NOMA can enhance spectral efficiency by allowing multiple users to share similar input, multiple users sharing the same frequency but using different modulation schemes and power levels to transmit their data instantaneously. Therefore, NOMA method is considered an effective method used in wireless communication structures.
Pd in NOMA systems is important from a security perspective to ensure that the legitimate users can transmit and receive their data without interference or eavesdropping. The authors conducted a comprehensive complexity analysis. It is a well-established fact that noise is an ever-present challenge, complicating the detection of NOMA waveforms. This research delved into the intricate matter of detecting NOMA signals within the 5G waveform context, so addressing the influence of noise components becomes imperative before signal detection.
The reduction of computational complexity in 5G candidate structures is crucial for practical implementation. In this regard, H-DCT-W emerges as a promising approach, demonstrating optimal detection performance even under low SNR conditions while keeping compu-tational demands in check. The authors’ study compared predefined thresholds with averaged PSDs as a test statistic to determine signal presence or absence. Validation of the proposed SS system was accomplished through ROC curves, and Monte Carlo simulations confirmed the reliability of the authors’ mathematical SS model. Significantly, the SS system did not rely on predefined data values or coherency with PUs and had the capability to distinguish between legitimate traffic and noise. In the MIMO-NOMA system, the transmitter uses multiple MIMO antennas to communicate with one user or multiple users using NOMA. Each user is assigned a different power level and signal, and these signals are simultaneously transmitted from the MIMO transmitter and detected at the receiver in a MIMO-NOMA system by H-DCT-W. H-DCT-W sophisticated detection algorithms are used in the MIMO-NOMA receiver to effectively separate signals to enhance signal detection. The use of MIMO in NOMA detection offered significant performance gains, such as enhanced signal-to-interference-plus-noise part (SINR) for the corresponding user and increased spectral efficiency.
This integration of MIMO and NOMA can lead to a better overall system performance, especially in scenarios with multiple users and challenging wireless channel conditions (low SNR). Also in this case, Pd with MIMO-NOMA of one user is shown in Fig. 7 and Pd with MIMO-NOMA of multiple users is shown in Fig. 8.
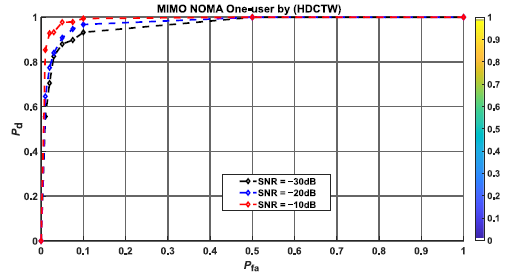
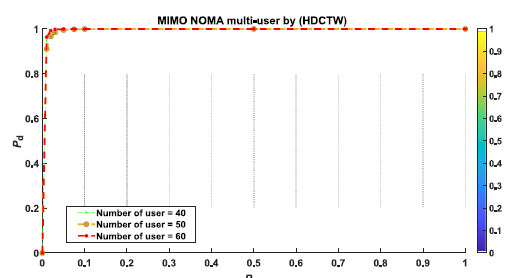
In Fig. 7 and 8, the MIMO-NOMA users transmit signals with different power levels and spatial signatures. Separating and detecting these signals at the receiver involves dealing with interference from other users. Multiple users’ detection algorithms are specifically designed to mitigate interference by the used H-DCT-W technique and multiple users detection helps in maximising the overall system capacity. Good Pd with low false alarm and low SNR lead to maximised spectrum efficiency.
While it is possible to perform a single-user detection in a MIMO-NOMA system, it would not fully use the capabi-lities of the system and would not take advantage of the main benefits of NOMA, which include serving multiple users in a non-orthogonal manner.
Comparison with previous research
Validation of the modelling process consisted of 1000 independent trials of the Monte Carlo model. The outcomes demonstrated that the MIMO-NOMA waveform exhibited a superior detection presentation attributed to its concise signal length and null coefficient elimination. Additionally, it was established that the SS system outdid alternative methods in MIMO-NOMA waveform that, characterised by a shorter signal length, exhibited a faster detection process. However, despite this, it displayed enhanced detection performance.
The comparison used a small PFA of 0.05 to preserve a minimal error rate probability, as shown in Fig. 9. NOMA-MIMO waveform factors remained defined based on standard resource and evaluations. Equation (18) high-lighted the significant impact of signal length (number of samples) on sensing parameters, with an increased sample size correlating with the improved detection performance. But in contrast, existing methods had limitations. A similar technique in Ref. 29 achieved a detection probability of 0.885 but required a complex system and struggled at SNR below −20 dB. The method in Ref. 42 reached a 0.868 detection probability, but demanded coherency and pre-defined information values, excelling at SNRs > 10 dB, but failing under −10 dB. In Ref. 43, an instant-producing purpose process with multi-antennas reached a 0.93 detection probability, yet the system faced challenges below SNR of 10 dB.
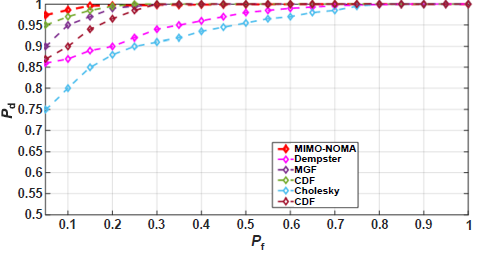
The approach in Ref. 44 achieved a detection probability of 0.96, but it requires coherence, pre-defined information, and a developed detection scheme. The covariance matrix suggested in Ref. 45 reached a 0.78 detection probability without pre-defined information, but used the Cholesky decomposition algorithm and the RB-established path machine system, resultant in the modest complexity and inadequacy for low SNR ( < −15 dB). On the other hand, the covariance matrix proposed in Ref. 46 needed no pre-defined information and reached a 0.78 detection probability, but failing under −10 dB. In Ref. 47, a similar method was used with unlike kinds of modulations, and the detection probability was 0.885. While a little of their modulations could sense when SNR was −20 dB, they needed a complex detection scheme.
The SS H-DCT-W method obtained in this paper overcame SNR challenges due to its low complexity and error rate. Significant results were shown for the MIMO-NOMA 5G waveform, effectively distinguishing among traffic beside AWGN noise. Table reviews the superior presentation of the suggested SS method in comparison to other studies, highlighting its higher detection probability, reduced false alarm rate, and enhanced error probability.
Table 2.
Comparison of MIMO-NOMA waveform factors with previous research.
Techniques |
PFA, 𝑷𝒅 |
𝑷𝒆 |
SNR (dB) |
Dempster-Shafer fusion |
0.05, 0.868 |
0.182 |
−10 |
Moment generating function |
0.05, 0.93 |
0.12 |
10 |
Feature detection covariance Matrix-Cholesky decomposition |
0.05, 0.78 |
0.27 |
−15 |
Cyclostationarity Feature detection |
0.05, 0.868 |
0.182 |
−10 |
H-DCT-W technique |
0.05, 0.971 |
0.079 |
−30 |
Comparison |
Suggested tech has a better sensing performance | Suggested tech has a lower scheme error | Suggested tech can work for a lower SNR |
Conclusions
The system showed superior performance across various parameters, including Pd, SNR tolerance, error detection system rates, and computational complexity, particularly in the context of NOMA 5G waveforms. Consequently, the authors’ SS method achieved a detection probability of higher than or equal to 0.96 while maintaining a false alarm probability below 0.05, and a universal scheme error probability of less than 0.09%. These outcomes underline the potential of NOMA as a feasible solution for traditional 5G applications, thanks to the authors’ algorithm advancements. Detecting and analysing 5G signals after they have been transmitted over a fibre optic system is crucial for maintaining a high-quality and reliable network. This comprehensive approach ensures that the 5G network operates efficiently and delivers the expected performance to support a wide range of appli-cations and services.
Authors’ statement
Research concept and design and the writing of the article Z.T.Y. and W.A.. Data analysis and interpretation and critical revision of the article Z.T.Y. and W.A.
References
-
Asgarirad, M., Jahromi, M. N. & Dana, A. Techno-economic model of fibre-to-the-home as 5G fronthaul: Evaluation of capital expenditures. IET Commun. 14, 4075–4080 (2020). https://doi.org/10.1049/iet-com.2020.0228
-
Aladeloba, A. O., Phillips, A. F & Woolfson, M. S. Performance evaluation of optically preamplified digital pulse position modu- lation turbulent free-space optical communication systems. IET Optoelectron. 6, 66–74 (2012). https://doi.org/10.1049/iet-opt.2011.0029
-
Kang, J. M., Kim, T.-Y., Choi, I. H., Lee, S.-H. & Han, S.-K. Self-seeded reflective semiconductor optical amplifier based optical transmitter for up-stream WDM-PON link. IET Optoelectron. 1, 77– 81 (2007). https://doi.org/10.1049/iet-opt:20050116
-
Grosso, G. & Höök, A. High bit rate characteristics of short pump pulses generated by stimulated Brillouin scattering in optical fibres. Electron. Lett. 29, 281–283 (1993). https://doi.org/10.1049/el:19930192
-
Shen, Ch. Experiences and Future Perspective of China Telecom on Optical Access Networks. in 2017 Optical Fiber Communications Conference and Exhibition (OFC) 1–3 (OSA, 2017).
-
Soni, G. A performance analysis of free-space optical link at 1,550 nm, 850 nm, 650 nm and 532 nm optical wavelengths. J. Opt.Commun. 39, 335–341 (2018). https://doi.org/10.1515/joc-2016-0118
-
Kaur, S. & Kakati, A. Analysis of free space optics link performance considering the effect of different weather conditions and modulation formats for terrestrial communication. J. Opt. Commun. 41, 463–468 (2020). https://doi.org/10.1515/joc-2018-0010
-
Salwa, M., Abd El-Naser, A. M., Abd El-Sami, F. E. & Rahed, A. N. Z. Performance evaluation of SAC-OCDMA system in free space optics and optical fiber system based on different types of codes. Wirel. Pers. Commun. 96, 2843–2861 (2017). https://doi.org/10.1007/s11277-017-4327-8
-
Gopal, R. Diversity Architectures for High Data Rate Ground- toSatellite Optical and EHF Links. in 36th International Communications Satellite Systems Conference (ICSSC) 23 (IEEE, 2018). https://doi.org/10.1049/cp.2018.1704
-
Matera, F. et al. Optical Network Slicing Approaches with Carrier Ethernet Tests. in 19th Italian National Conference on Photonic Technologies (Fotonica) 10 (IEEE, 2017). https://doi.org/10.1049/cp.2017.0185
-
Schrenk B. Milovancev, D. Vokic, N., Hübel, H. & Karinou, F. Radio-over-air with a face-to-face EML transceiver pair. in 45th European Conference on Optical Communication (ECOC) 4 (IEEE, 2019). https://doi.org/10.1049/cp.2019.0863
-
Oda, S., Sunnerud, H. & Andrekson, P. A. High efficiency and high output power fiber optic parametric amplifier. Opt. Lett. 32, 1776– 1778 (2007). https://doi.org/10.1364/OL.32.001776
-
Wang, Ch. et al. A broadband gold-coated photonic crystal fiber polarization filter with a high loss ratio of both polarizations at 1550 and 1310 nm. Photonics 8, 488 (2021). https://doi.org/10.3390/photonics8110488
-
Raza, R. & Hayat, S. H. Design and study of an optical fiber digital transmitter. Inf. Technol. J. 5, 433–438 (2006). https://doi.org/10.3923/itj.2006.433.438
-
Al-amaireh, H. & Kollar, Z. Reducing the Complexity of FS-FBMC Receivers Using Hopping DFT. in 2019 29th International Conference Radioelektronika (RADIOELEKTRONIKA) 1–5 (IEEE, 2019). https://doi.org/10.1109/RADIOELEK.2019.8733498
-
Pereira, L. A. M. et al. Implementation of a multiband 5G NR fiber- wireless system using analog radio over fiber technology. Opt. Commun. 474, 126112 (2020). https://doi.org/10.1016/j.optcom.2020.126112
-
Guillory, J. et al. Radio over Fiber Tunnel for 60 GHz Wireless Home Network. in Optical Fiber Communication Conference/National Fiber Optic Engineers Conference OWT6 (OSA, 2011). https://doi.org/10.1364/OFC.2011.OWT6
-
Hadi, M. U. & Murtaza, G. Fibre wireless distributed antenna systems for 5G and 6G services. Electronics 12, 64 (2023). https://doi.org/10.3390/electronics12010064
-
Alimi, I. et al. A review of self-coherent optical transceivers: fundamental issues, recent advances, and research directions. Appl.Sci. 11, 7554 (2021). https://doi.org/10.3390/app11167554
-
Jinno, M., Takara, H., Sone, Y., Yonenaga, K. & Hirano, A. Multiflow optical transponder for efficient multilayer optical networking. IEEE Commun. Mag. 50, 56–65 2012. https://doi.org/10.1109/MCOM.2012.6194383
-
Karar, A. S., El Falou, A. R., Barakat, J.M.H., Gürkan, Z.N. & Zhong, K. Recent advances in coherent optical communications for short-reach: Phase retrieval methods. Photonics 10, 308 (2023). https://doi.org/10.3390/photonics10030308
-
Jeong, H.-S., Cho, J.-H. & Sung, H.-K. Evaluation of performance enhancement of optical multi-level modulation based on direct modulation of optically injection-locked semiconductor lasers. Photonics 8, 130 (2021). https://doi.org/10.3390/photonics8040130
-
Xia, L. et al. Transfer learning assisted deep neural network for OSNR estimation. Opt. Express 27, 19398–19406 (2019). https://doi.org/10.1364/OE.27.019398
-
Algriree, W. et al. An analysis of 5G-MIMO communication system based SS for centralized cooperative and non-cooperative users. Egypt. Inform. J. 24, 161–172. (2023). https://doi.org/10.1016/j.eij.2023.02.003
-
Algriree, W. et al. A CR-5G network based on multi-user for various waveforms detection. Egypt. Inform. J. 23, 517–527 (2022). https://doi.org/10.1016/j.eij.2022.05.004
-
Liu, Y. et al. SNR model of optical fiber acoustic sensing system based on F-P structure. Photonics 10, 676 (2023). https://doi.org/10.3390/photonics10060676
-
Paredes-Páliz, D. et al. Radio over fiber: An alternative broadband network technology for IoT. Electronics 9, 1785 (2020). https://doi.org/10.3390/electronics9111785
-
Vallejo. L. et al. Usability of a 5G fronthaul based on a DML and external modulation for M-QAM transmission over photonically generated 40 GHz. IEEE Access 8, 223730–223742 (2020). https://doi.org/10.1109/ACCESS.2020.3042756
-
Van, D., Rimal, B.P., Maier, M. & Valcarenghi, L. PECO-FiWi: An energy conservation scheme for integrated fiber-wireless access networks. IEEE Trans. Wirel. Commun. 15, 3979–3994 (2016). https://doi.org/10.1109/twc.2016.2531694
-
Tang, Z., ZHANG, F. & PAN, S. 60-GHz RoF System for dispersion- free transmission of HD and multi-band 16QAM. IEEE Photon. Technol. Lett. 30, 1305–1308 (2018). https://doi.org/10.1109/lpt.2018.2845672
-
Wang, D. et al. Intelligent constellation diagram analyzer using convolutional neural network-based deep learning. Opt. Express 25, 17150–17166 (2017). https://doi.org/10.1364/oe.25.017150
-
Kim, H., Park, Y., Kim, J. & Hong, D. A low-complex SVD-based F-OFDM. IEEE Trans. Wirel. Commun. 19, 1373–1385 (2020).https://doi.org/10.1109/TWC.2019.2953540
-
Bendimerad, Y. & Bendimerad, F. T. Low complexity MIMO‐ RB‐ F‐ OFDM systems using antenna selection technique. IET Commun. 14, 152–157 (2020). https://doi.org/10.1049/iet-com.2019.0322
-
Dhua, S., Arjun, R., Appaiah, K. & Gadre, V. M. Complexity FBMC with Filtered OFDM for 5G Wireless Systems. in International Conference on Signal Processing and Communications (SPCOM) 1–5 (IEEE, 2020).https://doi.org/10.1109/SPCOM50965.2020.9179614
-
Guo, Z. Liu, Q., Zhang, W. & Wang, S. Low complexity implementation of universal filtered multi-carrier transmitter. IEEE Access 8, 24799–24807 (2020).https://doi.org/10.1109/ACCESS.2020.2970727
-
Fathy, S. A. Ibrahim, M., El-Agooz, S. & El-Hennawy, H. Low- complexity SLM PAPR reduction approach for UFMC systems. IEEE Access 8, 68021–68029 (2020).https://doi.org/10.1109/ACCESS.2020.2982646
-
Martínez, D. M. & Andrade, A. G. Performance evaluation of Welch's periodogram-based energy detection for spectrum sensing. IET Commun. 7, 1117–1125 (2013).https://doi.org.10.1049/iet-com.2012.0640
-
Elkourdi, M., Peköz, B., Güvenkaya, E. & Arslan, H. Waveform Design Principles for 5G and Beyond. in IEEE 17th Annual Wireless and Microwave Technology Conference (WAMICON) 1–6 (IEEE, 2016). https://doi.org/10.1109/WAMICON.2016.7483859
-
Abdoli, J., Jia, M. & Ma, M. OFDM: A New Waveform For Future Wireless Systems. in IEEE, 16th International Workshop on Signal Processing Advances in Wireless Communications (SPAWC) 66–70 (IEEE, 2015). https://doi.org/10.1109/SPAWC.2015.7227001
-
Wild, T., Schaich, F. & Chen, Y. 5G Air Interface Design Based on Universal Filtered (UF-) OFDM. in IEEE, 19th International Conference on Digital Signal Processing 699–704 (IEEE, 2014). https://doi.org/10.1109/ICDSP.2014.6900754
-
Schellmann, M. et al. FBMC-Based Radio Interface for 5G Mobile Networks: Challenges and Proposed Solutions. in 9th International Conference on Cognitive Radio Oriented Wireless Networks and Communications 1–6 (IEEE, 2014). https://doi.org/10.4108/icst.crowncom.2014.255708
-
Jang, W. M. Simultaneous power harvesting and cyclostationary spectrum sensing in cognitive radios. IEEE Access 8, 56333–56345 (2020). https://doi.org/10.1109/access.2020.2981878
-
Liu, X., Jia, M., Na, Z., Lu, W. & Li, F. Multi-modal cooperative spectrum sensing based on Dempster-Shafer fusion in 5G-based cognitive radio. IEEE Access 6, 199–208 (2018). https://doi.org/10.1109/access.2017.2761910
-
Chu, G., Niu, K., Wu, W. & Yang, F. MGF-based analysis of spectrum sensing over K−μ fading channels for 5G cognitive networks. IEEE Access 6, 78650–78658 (2018). https://doi.org/10.1109/access.2018.2885132
-
El-Alfi N. A., Abdel-Atty, H. M. & Mohamed, M. A. Sub-Nyquist cyclostationary detection of GFDM for wideband spectrum sensing. IEEE Access 7, 86403–86411 (2019). https://doi.org/10.1109/access.2019.2925047
-
Bao J. et al. Improved blind spectrum sensing by covariance matrix Cholesky decomposition and RBF-SVM decision classification at low SNRs. IEEE Access 7, 97117–97129 (2019). https://doi.org/10.1109/access.2019.2929316
-
Hu, F., Chen, B. & Zhu, K. Full spectrum sharing in cognitive radio networks toward 5G: A survey. IEEE Access 6, 15754–15776 (2018). https://doi.org/10.1109/access.2018.2802450