Received 29 Nov. 2023
Received in revised form 07 Feb. 2024
Accepted 08 Feb. 2024
Available on-line 11 Mar. 2024
Keywords: LED light sources; measurement method; luminous flux; integrating sphere; goniometer.
The paper presents a simple method of measuring the luminous flux value dedicated to LED light sources. This method uses information about a spatial radiation pattern of the lighting source under test and the results of illuminance measurements at the axis of this source. The method is described and the results of the measurements obtained using this method and the classical method are compared and discussed. Tests have been carried out for LED modules of different geometries. The measurement error of the considered method is analysed.
Solid-state light sources are used in lighting and auto-motive applications. The basic component of these sources are LED modules which consist of single LEDs operating on a common metal core printed circuit board (MCPCB) substrate [1, 2].
The properties of solid-state light sources are charac-terised by many electrical, optical, and thermal parameters. Information on the total light emitted is given in the form of luminous flux values. This parameter numerically characterises the light sent in all directions [3–5].
Manufacturers of solid-state light sources provide the value of this parameter for selected operating conditions of these sources. Usually, these are the maximum values of this parameter at a fixed value of the supply current [6–8]. On the other hand, it is known from many papers [9, 10] that the value of the luminous flux of the light emitted by LEDs depends on the current supplying these devices, temperature, mounting method, and the cooling system used. In order to characterise the optical properties of the considered light sources operating under fixed power and cooling conditions, it is necessary to measure the luminous flux.
There are several commonly used methods for measuring optical parameters of LED light sources using a spectrophotometer, a radiometer or a photometer, and an integrating sphere or a goniometer. A broad description of the adopted methods can be found in Refs. 4, 6, 9, and 10. When reviewing the source materials on LED measure-ments, it can be seen that for them to make any sense at all, a high-precision measurement method is necessary. Some factors can significantly affect the measurement results, such as the distance of the light source from the detector, the internal temperature of such a source, or the light-tightness of the measurement chamber in which the tested light source is placed.
In Refs. 10–12, multi-domain models of single LEDs and LED modules were proposed. These models were verified for different cooling conditions and different values of the supply current of the mentioned light sources. One of the optical parameters determined using the considered models is the luminous flux ΦV, the value of which depends, among others, on the value of the forward current and cooling conditions.
In Ref. 13, a setup for measuring the LED frequency response is proposed and analysed. It is dedicated to high luminous flux phosphor-coated white LEDs. In turn, the method and setup for parameter determination and experi-mental verification of a dynamic photo-electro-thermal model of LEDs with phosphor coating are described in Ref. 14. The results of research on a reflector used in a luminaire with variable luminous intensity distribution are presented in Ref. 15.
Important parameters of solid-state light sources are also the lifetime and reliability of these devices. References 16–19 illustrate the influence of selected parameters and cooling conditions on the lifetime and reliability of these light sources.
The classical method of measuring the luminous flux uses a photometric sphere with a suitable photodetector [4]. Such a device is characterised by large dimensions and is not widely available in engineering laboratories due to its high price. The classical method enables the measurement of the luminous flux for light sources of various shapes, dimensions, and ways of generating light.
The authors have developed an alternative method of determining the value of this parameter dedicated to solid-state light sources, which are characterised by small dimen-sions. The idea of this method was presented in Ref. 10.
This paper presents the concept of implementation of the developed measurement method and some measure-ment results. These results were compared with the results obtained using the classical method. The range of applica-tions of the developed method was discussed.
Section 2 describes the measurement method. Section 3 presents the selected measurement results. Section 4 analyses the presented method error.
The idea of the measurement method is based on a point measurement of the illuminance value obtained from the light source under test and the use of a known spatial radiation pattern. The light detector should be located at a known distance from the light source being tested. This method is implemented in five stages, including:
measurement of the illuminance E0 in the axis of the tested light source using a photometer placed at a known distance r from this source;
determination of the spatial radiation patterns of the light distribution emitted by the tested source from the measurements using a goniometer or from the data provided by the manufacturer;
approximation of the spatial radiation patterns by a second-degree polynomial whose argument is the emission angle and determination of the values of the coefficients a, b, and c of this polynomial appearing at the second power, the first power and the intercept, respectively;
reading from the spatial radiation pattern the value of the angle αmax for which the approximate value of illuminance is 0;
calculation of the value of the luminous flux ΦV from the dependence
\( \Phi_{\mathrm{V}}=2 \cdot \pi \cdot E_0 \cdot r^2 \cdot\left(\frac{a \cdot a_{\max }^2}{3}+\mathrm{c}\right) \cdot\left(1-\cos \left(\alpha_{\max }\right)\right) \) (1)
If a radiometer is used instead of the photometer in a), it will be possible to determine the value of the energy flux Φe using a formula analogous to (1), but instead of the illumination E0, it contains the optical power density Ie.
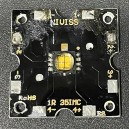
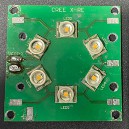
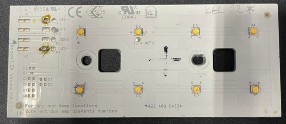
In order to verify the correctness of the measurement method described in section 2 (further called the original method), many measurements of luminous flux values of the selected light sources were carried out using this method and the classical method [4, 10]. The measure-ments were carried out for a single LED of the MCE type by Cree, mounted on a 35 × 35 mm MCPCB substrate, a Ring XRE module containing 6 LEDs of the XRE type placed on a circle of a diameter of 28 mm on a PCB containing a FR-4 substrate, a rectangular 8xXP-G2 module of dimensions of 120 × 50 mm containing 8 LEDs of the XP-G2 type situated at a distance of 20 mm from each other. All the measured LED modules are shown in Fig. 1.
Table 1 collects the operational parameters of LEDs operating in the LED modules tested. It can be seen that the value of the emitted luminous flux ΦV for all tested LEDs is in the range from 90 to 160 lm for the forward current IF = 0.35 A, while for diode XP-G2, the maximum forward current IFmax = 1.5 A, and for MCE and XRE diodes, the maximum forward current IFmax = 0.7 A. The value of the light distribution angle ranges from 90° for XRE diode to 120° for XP-G2 diode. The LEDs in each tested module are connected in series.
Table 1.
Operating parameters of the diodes contained in the tested LED modules [20, 22]
Power LED module |
Pmax [W] |
IFmax [A] |
[lm] |
Viewing angle [°] |
No. of LEDs in the module |
MCE |
2.8 |
0.7 |
100 |
110 |
4 |
Ring XRE |
2.8 |
0.7 |
90 |
90 |
6 |
8xXP-G2 |
4.5 |
1.5 |
160 |
120 |
8 |
The study also analyses the standard LED lamps marked as Lamp No. 1, Lamp No. 2 and Lamp No. 3. The view of the tested LED lamps is shown in Fig. 2. Table 2 summarises the most important technical parameters of the tested LED lamps.


Table 2.
Technical parameters of the tested LED lamps.
Light source |
ΦV [lm] |
Lifetime [h] |
P [W] |
CCT [K] |
Lamp LED Niviss (Lamp No. 1) |
270 |
50 000 |
4 |
2700 |
Lamp LED Spectrum (Lamp No. 2) |
1050 |
17 000 |
11.5 |
2700 |
Lamp LED Philips HUE (Lamp No. 3) |
806 |
20 000 |
9.5 |
3000 |
Analysing the value of the luminous flux ΦV for individual lamps, it can be seen that the lowest value is obtained for Lamp No. 1, while the same lamp has the longest lifetime, amounting to as much as 50 thousand hours. All the tested lamps have a correlated colour temperature (CCT) ranging from 2700 K to 3000 K, which indicates that they emit optical radiation of a warm white. Lamp No. 2 has the shortest lifetime. It is only 17 thousand hours.
The power P consumed from the power grid by the tested LED lamps ranges from 4 W for Lamp No. 1 to 11.5 W for Lamp No. 2. All the tested LED lamps during the experimental studies were powered by a rated alternating voltage with an RMS value of 230 V, while the supply voltage range of the selected lamps is much wider and can be adjusted in the range from 100 to 240 V.
The Philips HUE LED lamp (Lamp No. 3) is a wirelessly controlled light source produced by Philips Lighting, emitting white light. This lamp can be controlled using the Philips HUE application intended for mobile devices operating systems. This application allows you to adjust the CCT and illuminance values in the range from 1 to 100% of the nominal value in 1% steps. During the experimental tests, the CCT was set at 3000 K and the illuminance value was set at 100%.
For the measurements using the method described in detail in section 2, a goniometer described in Ref. 9 was used. It contains a head with an LP471 PHOT illumination probe, which is an integral part of the HD2302 photo-radiometer. The probe operates in the wavelength range from 400 to 760 nm.
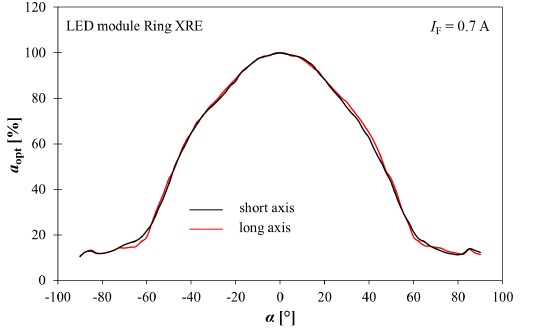
Fig. 3 shows the measured light distribution characteristics for the 8xXP-G2 LED module [Fig. 2(a)] and for the Ring XRE module [Fig. 2(b)]. The characteristics were measured for the forward current of IF = 0.7 A flowing through a single XP-G2 LED and through the entire LED module in two axes, hereinafter referred to as the short and long measurement axes. The distance of the measurement probe from the tested light source during the experimental tests was r = 25.6 cm, and the value of the measurement angle varied in the range from −90° to 90°.
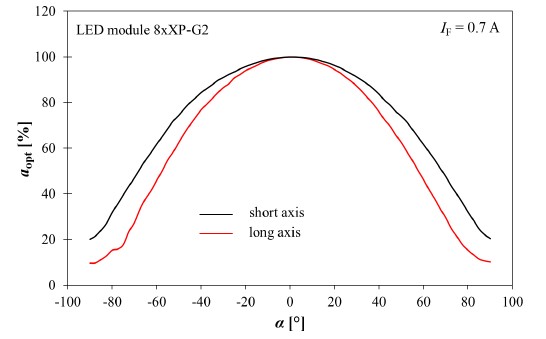
Analysing Fig. 3(a), it can be seen that the spatial radiation patterns for the long and short axis of the 8xXP-G2 module significantly differ from each other, and this difference increases with an increase in the angle α, at which the measurement probe is positioned. The observed difference in the spatial radiation patterns is caused by the irregular optical shape of the tested light source and the arrangement of LEDs on the MCPCB substrate.
In turn, analysing Fig. 3(b), it can be seen that there is no change in the light distribution characteristics for both modules. This is because the tested Ring XRE module has a regular optical shape and individual LEDs are situated in a circle.
Fig. 4 shows the measured spatial radiation patterns for the tested LED lamps. During the measurements, the tested LED lamps were powered by an alternating voltage with an RMS value of 230 V. The distance between the top of the measured LED lamp and the sensor illuminance was equal to: 20.1 cm (Lamp No. 1), 24.8 cm (Lamp No. 2), and 25.1 cm (Lamp No. 3), respectively.
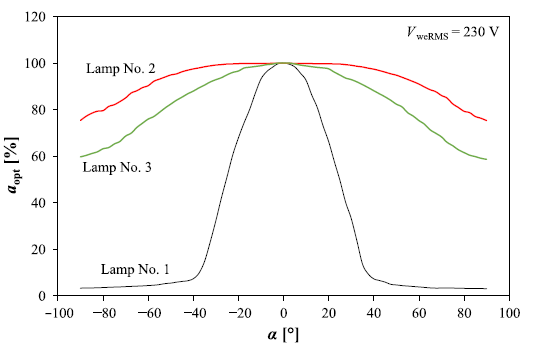
It is visible that the narrowest characteristic was obtained for Lamp No. 1, which is the result of the use of a collimator lens in its construction. The value of the viewing angle of this lamp is ± 40°, outside this range, the values are negligible and do not exceed several percent of the normal-ised illuminance value. Lamps No. 2 and 3 have much wider spatial radiation patterns. This is due to the Lambertian lenses used, and the normalised illuminance values are not lower than 60% for an observation angle of ± 90°.
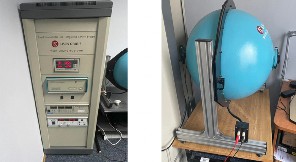
In order to verify the correctness of the developed method, the obtained measurement results were compared with the results obtained using the LPCE-2 measurement system by Lisun Group [23] shown in Fig. 5. The measurements were made for selected values of the LEDs forward current i, with the current flowing through each diode contained in the LED module being the same.
During the measurement, no additional cooling systems for the tested LED modules and LED lamps were used. The indispensable values of parameters describing spatial radiation patterns, e.g., αmax, were obtained by the measurements performed by the authors. For the 8xXP-G2 LED module, for which spatial radiation patterns obtained for short and long axes are different, the value of αmax obtained for short axis was used.
Fig. 6 compares the measurement results obtained using the original method (red bars) with the classical method (blue bars) for the LED modules tested.
As can be seen, the measurement results obtained using the original method are slightly inflated in relation to the results obtained using the classical method. However, the visible discrepancies do not exceed 10%, and in most cases the deviation between the results obtained using both methods is about 5%. These results confirm the practical usefulness of the original method. The presented results also show that the dependence of the luminous flux of the current i is described by a nonlinear function.
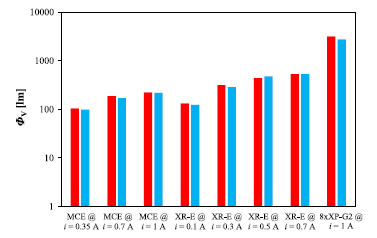
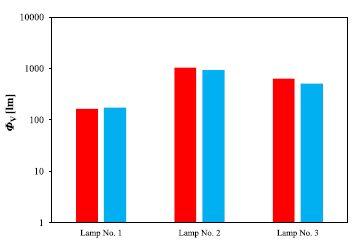
Fig. 7 compares the measurement results obtained using the original method (red bars) with the classical method (blue bars) for the tested LED lamps.
Analysing Fig. 7, it can be seen that the lowest value of the luminous flux ΦV was obtained for Lamp No. 1. It is only 174.19 lm. The highest value of the luminous flux was obtained for Lamp No. 2, and it amounts to 922.72 lm. The above luminous flux values were measured using the original method described in section 2. The same parameters of the LED lamps were measured using the classical method. The discrepancies between the measurement results obtained using both methods do not exceed 10%.
When determining the luminous flux value using the original method, the error of the measurements was also analysed. For this purpose, the complete differential method [24] was used concerning (1). In the formula enabling the determination of the luminous flux value, the parameters with measurement uncertainty are:
illuminance E0 – the maximum uncertainty was determined ΔE0 = 4% of the measured illuminance value, under the measurement probe calibration uncertainty provided by the manufacturer;
angle αmax – the maximum uncertainty was estimated Δαmax = 2.5°, as the accuracy of the indications of the head angle inclination to the axis of the light source in the goniometer;
distance r of the probe from the light source – the maximum uncertainty Δr = 1 mm was estimated as the accuracy of the measure used to measure this distance. The absolute measurement error of ΦV is given by
\( \begin{aligned} \Delta \Phi_{\mathrm{V}} & =\left|2 \cdot \pi \cdot r^2 \cdot\left(\frac{a \cdot \alpha_{\max }^2}{3}+c\right) \cdot\left(1-\cos \left(\alpha_{\max }\right)\right)\right| \cdot \Delta E_0 \\ & +\left|\frac{4}{3} \cdot \pi \cdot a \cdot r^2 \cdot E_0 \cdot \alpha_{\max } \cdot\left(1-\cos \left(\alpha_{\max }\right)\right)\right| \cdot \Delta \alpha_{\max } \\ & +\left|4 \cdot \pi \cdot E_0 \cdot r \cdot\left(\frac{a \cdot \alpha_{\max }^2}{3}+c\right) \cdot\left(1-\cos \left(\alpha_{\max }\right)\right)\right| \cdot \Delta r . \end{aligned} \) (2)
After substituting the numerical data for an exemplary light source – the Ring XRE module, with a forward current of IF = 0.3 A in the derived formula, ΔΦV = 15.78 lm was obtained. This result is the value of the absolute luminous flux measurement error. The relative error of this measurement is δΦv ≈ 5.03%. Therefore, in the case of the Ring XRE module, when powered by a forward current of IF = 0.3 A, the luminous flux value Φv = 314 ± 15.78 lm.
Fig. 8 shows the values of the luminous flux measurement error ΦV for the tested LED modules.
Analysing FFig. 8, it can be seen that the highest measurement error was obtained for the 8xXP-G2 module supplied with the current value of 1 A, and this error was equal to about 13%. The lowest measurement error was obtained for the XRE module supplied with the current value of 700 mA, and this error was only 0.23%.
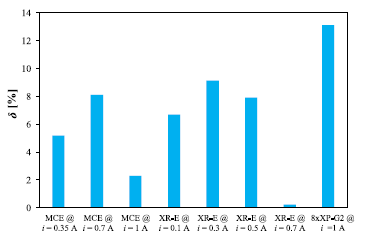
Fig. 9 shows the luminous flux measurement error values for the tested LED lamps.
In Fig. 9, it can be seen that the lowest value of the measurement error was obtained for Lamp No. 1, and the highest value for Lamp No. 3. They are 7% and as much as 19.93%, respectively. It can also be noticed that in the case of LED lamps, the higher error values were obtained than in the case of LED modules, which is related to the proce-dure of measuring the spatial radiation patterns using the goniometer. The light distribution angle was measured only within the range of changes in this angle from −90° to 90°.
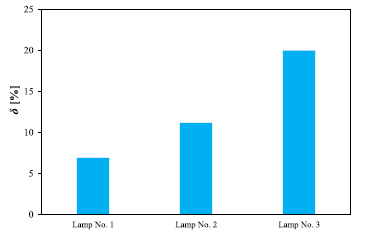
Table 3 compares the values of the relative measure-ment error of the luminous flux δ (calculated error) and the quotient of the difference between the results measured using the new method and the classical method through the measured value of this flux (measured error). Such a comparison was performed for all tested LED modules and LED lamps.
Table 3.
Comparison of the calculated and measured error of the luminous flux measurement.
Light source |
Calculated error [%] |
Measured error [%] |
MCE@ i = 0.35 A |
4.68 |
5.47 |
MCE@ i = 0.7 A |
4.75 |
8.85 |
MCE@ i = 1 A |
4.71 |
2.36 |
Ring XRE@ i = 0.1 A |
3.38 |
7.18 |
Ring XRE@ i = 0.3 A |
5.03 |
10.04 |
Ring XRE@ i = 0.5 A |
5.09 |
7.32 |
8xXP-G2@ i = 1 A |
4.98 |
15.12 |
Lamp No. 1 |
3.97 |
6.88 |
Lamp No. 2 |
4.41 |
11.85 |
Lamp No. 3 |
4.46 |
19.93 |
It is easy to observe that the relative discrepancy between the values of the luminous flux measured using both methods is typically bigger than the calculated relative error δ for the tested modules and lamps. This discrepancy results from such factors as the difference in the spectral wavelength of the spectroradiometers used in both measurement methods and limited accuracy of the LPCE-2 spherical measurement system and a wider than the ± 90o emission angle of the tested light sources.
This paper presents the concept of the original method of measuring the luminous flux characterising LED light sources. The presented method is easy to implement and does not require the use of specialised measuring equipment. The results of the considered method correctness verification prove that the deviation of the obtained measurement results in relation to the classical method is typically about 5%.
Such good conformity results were obtained for LED light sources, in which the size of the active area is small in relation to the distance of this source from the photometer and characterised by the central symmetry. In the case of the light sources that do not show the central symmetry (rectangular LED modules), the deviation between the results obtained using both methods is bigger and can reach even 10%. This means that the presented measurement method is valid mainly for small-size LED sources with a rotationally symmetric spatial radiation pattern.
For many of the tested devices, the recommendation of the minimum distance between the measurement probe and these devices given in Ref. 25 is fulfilled. Only for the largest LED module for one axis, this recommendation is not fulfilled. In the future, some investigations illustrating the considered distance influence on the proposed method accuracy will be performed.
Research concept and design, K.G. and P.P.; collection and assembly of data, A.K.; data analysis and interpreta-tion, K.G. and A.K.; writing the article, K.G., A.K., and P.P.; critical revision of the article, K.G. and P.P.; final approval of the article, K.G. and P.P.
Weir, B. Driving the 21st century’s lights. IEEE Spectr. 49 , 42–47 (2012). https://doi.org/10.1109/MSPEC.2012.6156864
Martin, P. S. et al. High Power White Led Technology for Solid State Lighting. Lumileds http://xgistor-echo.scorchingbay.nz/files/Electronics/Led-Info/SPIE2001.pdf
Schubert, E. F. Light emitting diodes. 2nd edition. (Cambridge University Press, 2008). https://doi.org/10.1017/CBO9780511790546
JEDEC Standard JESD51-52: Guidelines for combining CIE 127- 2007 total flux measurements with thermal measurements of LEDs with exposed cooling surfacehttps://www.intertekinform.com/en-GB/standards/jedec-jesd-51-52-2012-1128077_saig_jedec_jedec_2616248
JEDEC Standard JESD51-51: Implementation of the electrical test method for the measurement of real thermal resistance and impedance of light-emitting diodes with exposed cooling.https://standards.globalspec.com/std/1518764/JEDEC%20JESD%2051-51
Young, R. Measuring light emission from LEDs. Proc. SPIE 6355, 6355OH (2006). https://doi.org/10.1117/12.692731
Leśko, M., Różowicz, A., Wachta, H. & Różowicz, S. Adaptive luminaire with variable luminous intensity distribution. Energies 13, 721 (2020). https://doi.org/10.3390/en13030721
Martin, G. et al. Luminaire digital design flow with multi-domain digital twins of LEDs. Energies 12, 2389 (2019). https://doi.org/10.3390/en12122389
Górecki, K., Ptak, P. & Bruski, Ł. Spatial Radiation Patterns of Selected Solid State Light Sources. in 28th International Conference “Mixed Design of Integrated Circuits and Systems” 222–227 (IEEE, 2021). https://doi.org/10.23919/MIXDES52406.2021.9497566
Górecki, K. & Ptak, P. New dynamic electro-thermo-optical model of power LEDs. Microelectron. Reliab. 91, 121–124 (2018). https://doi.org/10.1016/j.microrel.2018.07.132
Baran, K., Różowicz, A., Wachta, H. & Różowicz, S. Modelling of selected lighting parameters of LED panel. Energies 13, 3583 (2020). https://doi.org/10.3390/en13143583
Poppe, A., Farkas, G., Szekely, V., Horvath, G. & Rencz, M. Multi- domain Simulation And Measurement of Power LEDs and Power LED Assemblies. in 22nd Annual IEEE Semiconductor Thermal Measurement and Management Symposium 191–198 (IEEE, 2006) https://doi.org/10.1109/STHERM.2006.1625227
Salvador, P., Valls, J., Corral, J. L., Almenar, V. & Canet, M. J. Linear response modeling of high luminous flux phosphor-coated white LEDs for VLC. J. Light. Technol. 40, 3761–3767 (2022). https://doi.org/10.1109/JLT.2022.3150907
Lee, A. T. L., Chen, H., Tan, S.-Ch. & Hui, S. Y. New dynamic photo-electro-thermal modeling of light-emitting diodes with phosphor coating as light converter—part II: Model parameter determination and practical verification. IEEE J. Emerg. Sel. Topics Power Electron. 8, 780–793 (2020). https://doi.org/10.1109/JESTPE.2018.2889113
Leśko, M. & Różowicz, A. Influence of the reflector properties on the photometric characteristics of a luminaire with variable luminous intensity distribution. Prz. Elektrotech. 100, 199–203 (2024). https://doi.org/10.15199/48.2024.01.41
Górecki, K., Kowalke, W. & Ptak, P. Influence of quality of mounting process of RF transistors on their thermal parameters and lifetime. Appl. Sci. 12, 6113 (2022).https://doi.org/10.3390/app12126113
Castellazzi, A., Gerstenmaier, Y. C., Kraus, R. & Wachutka, G. K. M. Reliability analisys and modeling of power MOSFETs in the 42-V-PowerNet. IEEE Trans. Power Electron. 21, 603–612 (2006). https://doi.org/10.1109/TPEL.2006.872382
Chang, M.-H., Das, D., Varde, P. V. & Pecht, M. Light emitting diodes reliability review. Microelectron. Reliab. 52, 762–782 (2012).https://doi.org/10.1016/j.microrel.2011.07.063
Hegedus, J., Hantos, G. & Poppe, A. Lifetime modelling issues of power light emitting diodes. Energies 13, 3370 (2020). https://doi.org/10.3390/en13133370
Datasheet XLamp MC-E. Cree Inc. (Accessed: Nov.16th, 2023). https://www.maritex.com.pl/product/attachment/42170/7f487112d77e7eb8a0e73e0de16be2e1
Datasheet XLamp XR-E. Cree Inc. (Accessed: Nov. 16th, 2023). https://downloads.cree-led.com/files/ds/x/XLamp-XRE.pdf
Datasheet XLamp XR-E. Cree Inc (Accessed: Nov. 16th, 2023).https://downloads.cree-led.com/files/ds/x/XLamp-XPG2.pdf
Website Lisun Group (Accessed: Nov. 16th, 2023). https://www.lisungroup.com
Measurement, Instrumentation and Sensors. Handbook. 2nd Edition. (eds. Webster, J. G. & Eren, H.) (CRC Press, Boca Raton, 2018). https://doi.org/10.1201/9781315217109
International Comnission on Illumination. CIE 70, 1987 Edition – The Measurement of Absolute Luminous Intensity Distributions. https://www.lisungroup.com/wp-content/uploads/2020/02/CIE-70-1987-Standard-Free-Download.pdf