Non-line of sight analysis for vehicular visible light communication system: Impact of artificial light source and weather conditions
- Electronics and Communications Department, Higher Technological Institute, 10th of Ramadan city, Egypt
- Electronics and Communications Department, College of Engineering and Technology, Arab Academy for Science, Technology and Maritime Transport, Alexandria, Egypt
- Electronics and Communications Department, Zagazig University, 44519 Zagazig, Egypt
Article Info
Received 10 Jan. 2024
Received in revised form 05 Mar. 2024
Accepted 12 Mar. 2024
Available on-line 07 May 2024
Keywords: Artificial light source; laser diode; optical amplifier; non-line of sight; Q-factor; vehicular communication
Abstract
Visible light communication is seen as a crucial technology within optical wireless communication systems. The technology of vehicular visible light communication holds significant importance in the context of connected vehicles. This technology can serve as a supplementary solution to vehicular systems that are based on radio frequency. In this paper, the authors conduct an analysis of the performance of both line-of-sight and non-line-of-sight vehicle-to-vehicle visible light communication systems under the effect of artificial light source and weather conditions, including clear, hazy, and foggy weather. A practical vehicular laser diode, a street lamp, and an avalanche photodiode are used to design the proposed system model. Performance enhancement for the proposed system is achieved using an optical amplifier at the receiving end. An artificial light source of light-emitting diode Corn-type is used to represent an ambient artificial light source. Different metrics such as quality factor and bit error rate are used to assess the system performance of the non-line-of-sight-vehicular communication system. The proposed line-of-sight model achieves a data rate of 25 Gbps, supporting a distance of 80 m under clear sky and hazy atmospheric conditions. For foggy weather, an attainable link distance of 70 m is achieved. The achieved results emphasize the suitability of the suggested models for vehicular applications in real world environment.
Introduction
Lighting technology is one of the major fields in the last decade that can be used as a complementary solution to radio frequency (RF) technology. Visible light communi-cation (VLC) stands as a crucial technology facilitating data transmission by modulating information onto the intensity of light emitted from light-emitting diodes (LEDs) or laser diodes (LDs). VLC possesses numerous advantages, including high data rates, minimal latency, resilience against electromagnetic interference, and increased security. Most research papers focus on the importance of such technology for indoor and outdoor applications [1].
VLC has been studied intensively in the field of indoor applications [2, 3]. Its application in outdoor communi-cation is relatively new. One of the most encouraging prospects for outdoor VLC lies in the application of intelligent transportation system (ITS) technology. This technology relies on the use of LED or LD modules serving as a transmitter and using the avalanche photodiode (APD) as an optical receiver to realise vehicular visible light communication (VVLC) systems [4, 5].
VVLC technology was applied in the late 1990s for traffic information systems. Elements of infrastructure, such as road signs, street lighting, or traffic lights, have the capability to convey information to the vehicle driver. This technology is called infrastructure-to-vehicle (I2V) technology [6].
VVLC technology has many advantages such as its directionality, significant bandwidth existing in the visible light spectrum enabling faster data transfer speeds, very low induced interference, and a smaller collision domain. Some of the main drawbacks of this technology are the short-range communication, inability to propagate through opaque objects such as metal, plastic, and wood, suffering from environmental impacts such as weather conditions, LED non-linearities, and the noise induced in the receiving end.
Weather conditions like rain, fog, and snow considerably diminish the performance of such systems. The transmitted light waves may suffer from absorption and scattering [7]. The performance of such systems is notably influenced by both natural and artificial lighting. Sunlight is considered as a natural light source which induces shot noise at the receiving end [8]. Advertisement boards and roadside lighting are examples of artificial light sources that can cause interference [9]. The reflectance of the road surface is another crucial factor for VVLC, significantly affecting the performance of these systems. Therefore, the objective of this article includes:
- Discussing the working mechanisms and evaluating the performance of the line-of-sight (LoS) and non-line of sight (NLoS) LD-based VVLC system considering the impact of various climatic conditions, including clear, hazy, and foggy skies. This describes the practical VLC channel more precisely.
- Investigating how the presence of an ambient artificial LED light source, such as ESL-CORN-GH-36 Watt, influences the performance of the suggested systems.
- Comparing the performance of the LoS and NLoS models for different atmospheric conditions demonstra-ting how various system parameters impact both the system quality and output power
- Enhancing the performance of the system by using an optical amplifier.
In this paper, the authors focus on exploring the properties of the LoS and NLoS-VVLC, taking under consideration the effect of an ambient artificial light source and different weather conditions.
The remaining sections of the paper are organised in the following manner. Section 2 shows the previous studies. Section 3 studies the analysis of the suggested LoS model with a focus on the influence of different atmospheric conditions, furthermore, investigating the effect of an artificial light source.
This section also explores the influence of the optical amplifier on enhancing the performance of the proposed LoS-VVLC model. Section 4 demonstrates the performance analysis of the suggested NLoS model by incorporating the influence of ambient artificial light sources and considering atmospheric conditions. Performance evaluation for the proposed model shows the achievable link distance for such proposed models which can achieve the acceptable quality factor (Q-factor) and the best bit error rate (BER). In conclusion, section 5 offers the final remarks.
Previous studies
VVLC systems have recently been the subject of much advanced research. For example, in Ref. 1, the authors discussed a design and performance evaluation of a VVLC model under diverse atmospheric conditions and varying system parameters. Two light sources have been used in the proposed work. The initial model used LEDs for VVLC, while the second model used LDs. The optical receiver in use was a practically measured APD. The LED-based model has achieved a data rate of 60 kbps over a distance of 80 m, while the LD-based model has achieved a significantly higher data rate of 25 Gbps over a distance of 190 m. The effect of the ambient artificial light source on the perfor-mance of the system was neglected in this work.
In Ref. 10, the performance of the VVLC system has been studied with a focus on the impact of NLoS compo-nents. The authors conducted experiments to measure the impact of the NLoS component under different conditions. A model has been proposed to estimate the NLoS component based on the strength of the received signal and the distance between the transmitter and receiver.
In Ref. 11, an experimental demonstration of the vehicle-to-vehicle (V2V)-VLC system has been performed using a stereo camera and an LED light source. The authors suggested a novel approach to enhance the perception of a vehicle surroundings in NLoS scenarios. The stereo cameras capture images from different angles allowing the reconstruction of 3D images of the environment.
Dixit et al. [12] focused on the analysis of the NLoS-VLC system. The key aspects of the performance analysis included studying channel characteristics such as multipath propagation, path loss, and interference. A mathematical expression for the BER was derived. The simulation results verified the analytical results.
In Ref. 13, the authors studied the optical system design at the receiving end of a VVLC system which has a great influence on the reliability of V2V-VLC systems. The authors also discussed the system performance based on the relative positions of the cars. The impact of different system parameters such as receiver diameter and bandwidth has also been investigated in the proposed work.
Turan et al. [14] investigated the VVLC system performance with the influence of noise sources. The noise was identified from the data obtained from the Allan variance (AVAR) method which provides a time-series analysis for identifying the noise. The authors provided a convolution autoencoder (CAE)-based denoising scheme for the reduction of the noise and enhancing the performance of the VVLC system.
Line-of-sight propagation model using an ambient artificial light source
Most research work in VVLC systems focuses on establishing a direct LoS connection between transmitter and receiver. In this section, extensive work has been conducted on a proposed model that relies on establishing a direct LoS path between two vehicles.
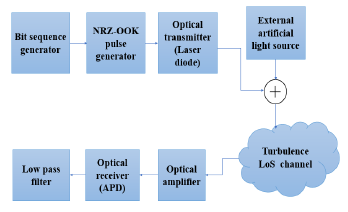
Fig. 1 depicts the fundamental block diagram of the suggested LoS-VVLC model, using an LD as the optical source, as well as an APD as the optical receiver. The proposed model uses a non-return-to-zero (NRZ) modula-tion scheme. An ESL-CORN-GH-36 W-type ambient artificial light source is added to the proposed model to represent the artificial light source.
When compared to LED-based VVLC systems, LD-based systems offer several advantages such as high optical power, wide modulation bandwidth, and superior efficiency. These advantages make LDs a better choice as a front-end transmitter for VLC and facilitate seamless integration with solid-state lighting technology [15]. For vehicular appli-cations, it is better to use a blue LD with a wavelength of 450 nm.
Using a blue LD proves to be a favourable option for use in VVLC systems. In the authors’ proposed work, a blue LD of Osram PL 450B-type is used. The LD-based VVLC systems offer several advantages compared to their counterparts that use LEDs. These advantages include faster transmission speeds, longer transmission distances, and higher modulation bandwidth [1]. A high data rate can be obtained with a suitable link distance that can be achieved between the two vehicles under different weather conditions. This type of laser has a high output optical power and a high modulation bandwidth [16, 17].
As illustrated in Fig. 1, a stream of bits is generated using the bit sequence generator. Then, the pulse generator converts the stream of bits into an electrical signal. The optical source which represents an Osram PL 450B-type LD can be used to convert the electrical signal into an optical signal. The LD in the proposed model represents the high beam headlamp of the first car.
Table 1 shows the specifications of the LD light source, wireless channel, and APD receiver used in the suggested model. The APD of the silicon (Si)-type, specifically the Hamamatsu model (S8664-1010) is used in the proposed system model [1].
Table 1.
Characteristics of the LD optical source, wireless channel, and receiver [1].
Parameter |
Value |
Transmitted power, 𝑃 |
1 W |
Wavelength, 𝜆 |
450 nm |
Receiver bandwidth, 𝐵 |
65 MHz |
Detector responsivity, 𝑅 |
0.28 A/W |
Load resistance, 𝑅𝑙 |
50 Ω |
Surface dark current, 𝐼𝑠 |
10 nA |
Transmitter aperture diameter, 𝑑𝑇 |
1 cm |
Receiver aperture diameter, 𝑑𝑅 |
1.5 m |
Beam divergence, 𝜃 |
2 mrad |
Link distance, 𝑑 |
80 m |
An ESL-CORN-GH-36 W-type ambient artificial light source was added to the proposed model to represent the artificial noise source. Table 2 represents the numerical parameters of the external artificial light source. The output powers of two light sources are added together using a power combiner and pass through the turbulence optical wireless communication channel.
Table 2.
Numerical parameters of the external artificial light source.
Parameter |
Value |
Type |
ESL-CORN-GH-36 W |
Transmitted Power |
36 Watt |
Input voltage |
AC 85-265 V |
Range of frequency |
50–60 Hz |
Light source |
High-power LED chips 36 pcs |
Light output (Lumens) |
2800 lm |
Power factor |
> 0.9 |
Material |
Aluminium |
The performance of the VVLC system can be signifi-cantly influenced by the instability of the atmospheric channel caused by varying meteorological conditions like haze, fog, rain, dust, and snow. This results in a consid-erable degradation in the absorption and scattering mechanisms. In the proposed model, the effect of clear, hazy, and foggy weather on the performance of the system will be discussed.
Fog has a substantial influence on the performance of the vehicular system. An attenuation for the propagated light will occur because of foggy weather and there will be a limitation in the obtained distance and the output received signal power [18]. For studying the effect of fog, the Mie scattering model is used, where the dominant factor in a thick foggy environment is the scattering resulting from fog drops. Detailed parameters are required in this sophisti-cated method for assessing the impact of fog. Alternatively, a simpler approach that relies on visibility can be employed [19]. Table 3 illustrates the attenuation loss attributed to various atmospheric conditions.
Table 3.
Attenuation loss in diverse atmospheric conditions [1].
Atmospheric condition |
Attenuation loss (dB/km) |
Clear sky |
0.4 |
Haze |
4 |
Fog |
21 |
In the proposed study, the authors consider the impact of both attenuation loss and geometrical loss. The attenuation loss primarily occurs because of atmospheric turbulence. The presence of geometrical loss becomes evident as the beam width between the transmitting and receiving ends expands. The geometrical loss can be formulated as [1]
\( G L(d B)=-20 \log \left[\frac{d_R}{d_T+\theta \cdot d}\right] \) (1)
where 𝑑𝑅 refers to the diameter of the receiver, 𝑑𝑇 is the diameter of the transmitter, 𝜃 is the beam divergence and 𝑑 is the distance separating the transmitter and the receiver.
The distance at which the optical power is decreased to 2% can be considered as the definition of visibility. In terms of visibility, the attenuation loss is given by [20]:
\( \alpha=10 \ln [\gamma(\lambda)] \) (2)
with
\( \gamma(\lambda)=\frac{3.91}{V}\left(\frac{\lambda}{550 \mathrm{~nm}}\right)^{-T} \) (3)
where 𝑉 represents the range of visibility, λ represents the operational wavelength, and 𝑇 is the coefficient character-ising the fog thickness. This factor can be computed using the Kruse model based on the visibility factor, as explained in Ref. 21
\( T= \begin{cases} 1.6 & \text{if } V > 50 \\ 1.3 & \text{if } 6 < V < 50 \\ 0.585 V^{1/3} & \text{if } V < 6 \end{cases} \) (4)
The signal that has been received 𝑦𝑟(𝑡) is expressed as
\( y_r(t)=R \cdot x(t) * h(t)+n(t) \) (5)
Here, 𝑅 represents the responsivity of the photodiode (PD), 𝑥(𝑡) denotes the transmitted signal, ℎ(𝑡) represents the channel impulse response (CIR), and 𝑛(𝑡) corresponds to the noise.
At the receiver, the optical signal is passed through an optical amplifier to improve the effectiveness of the suggested model. Subsequently, the optical signal undergoes processing through the APD receiver transforming it from an optical signal to an electrical one. At the receiving end, two different types of noise are produced: thermal noise and shot noise.
In the proposed work, the effect of the two different noise sources is taken under consideration. To mitigate the impact of thermal and shot noise, a low-pass filter is incorporated [22]. The cumulative noise variance is the combination of shot noise and thermal noise, and it can be expressed as [23]
\( \sigma_{\text {total }}^2=\sigma_{\text {shot noise }}^2+\sigma_{\text {thermal noise }}^2 \) (6)
where 𝜎2shot noises is the variance attributed to shot noise and 𝜎2thermal noises is the variance attributed to thermal noise. The thermal noise is given by [1]:
\( \sigma_{\text {thermal }}^2=4\left(\frac{k_B T_k}{R_l}\right) F_n B \) (7)
where 𝑘𝐵 is the Boltzmann constant, 𝑇𝑘 is the absolute temperature, 𝐹𝑛 is the noise figure, 𝐵 is the PD bandwidth, and 𝑅𝑙 is the load resistance.
The shot noise is given by [1]:
\( \sigma_{\text {shot noise }}^2=2 q_e G^2 F\left(I_{\text {inc }}\right) B \) (8)
where 𝑞𝑒 is the charge of the electron, 𝐺 is the gain of the PD, 𝐹 is the excess noise, 𝐼𝑖nc is the photocurrent generated as a result of the received optical power, represented as
\( I_{\text {inc }}=G A_r \int_{\lambda_1}^{\lambda_2} R P_{\text {inc }}(\lambda) T_0(\lambda) d \lambda \text {, } \) (9)
where 𝐴r is the receiver effective area, 𝜆1 and 𝜆2 are the wavelengths within the visible light spectrum, and 𝑇0(𝜆) is the optical filter transmittance.
Performance enhancement of the suggested line-of-sight vehicular visible light communication model.
In this section, an analysis of the LoS model has been obtained for different weather conditions to obtain the maximum acceptable link distance, Q-factor, BER, and the signal power of the channel. Optical system simulation tools and Matlab programs are used in the analysis of the proposed systems.
The Q-factor of an optical wireless communication (OWC) system is a measure of the overall performance and reliability of the system. It takes into account various factors such as signal-to-noise ratio (SNR), BER, link distance, and other parameters that affect the system ability to deliver high-quality and error-free optical communication
A higher Q-factor indicates better performance and higher reliability of the optical wireless system. The minimum acceptable values for the Q-factor of a free space optical (FSO) channel depend on a specific application and desired level of performance. For most FSO systems, a Q-factor of around 5 or higher is often considered acceptable [1].
The BER is a dimensionless metric that calculates the ratio of the number of bit errors to the total number of transferred bits over a given period. For example, if a pattern generator sends 1000 bits to the receiver and the receiver detects one error, the resulting BER would be 0.001.
The closed form approximation of BER for on-off keying (OOK)-NRZ is given by [1]
\( B E R=\frac{1}{2} \operatorname{erfc}\left(\frac{Q}{\sqrt{2}}\right) \) (10)
where 𝑒rcf(.) is the complementary error function and 𝑄 is the quality factor of the system, which is represented as
\( Q=\frac{\sqrt{2} R P_R}{2 \sigma_n} \) (11)
where 𝜎𝑛 is the standard deviation and 𝑃𝑅 is the received power.
The optical amplifier can be used at the receiving end to enhance the performance of the vehicular LoS model. Table 4 illustrates the performance enhancement of the proposed model with the presence of an optical amplifier. As can be seen from the obtained results, it can be concluded that the system performance is improved by the optical amplifier by increasing the maximum obtained link distance and Q-factor and reducing the BER of the system. Therefore, incorporating an optical amplifier at the receiving end is advantageous for the VVLC system
Table 4.
Comparison between the obtained results for the LoS model without and with the use of the optical amplifier.

Maximum attainable link distance under various weather conditions
In this section, the influence of the link distance on the performance of the LoS-VVLC system is examined under diverse weather conditions and in the presence of an external light source. Fig. 2 illustrates the relation between the link distance and the Q-factor for different weather conditions and under the effect of the external noise source with a data rate of 25 Gbps. As shown in Fig. 2, it can be inferred that with an increase in the link distance, the Q-factor of the system experiences a notable decrease. For clear and hazy weather conditions, the maximum attainable link distance is 80 m which produces a Q-factor of 6.67 and 6.25, respectively. For foggy weather, the maximum attainable link distance is 70 m which produces a Q-factor of 6.16.

Figure 3 illustrates the impact of the link distance on the BER for clear, hazy, and foggy weather conditions, respectively. As the link distance is increased, the BER is increased. To optimize the system performance, the maximum achievable link distances are 80, 80, and 70 m for clear, hazy, and foggy weather, respectively. With these link distances, the best BER is obtained with values of 1.21 · 10-11, 1.98 · 10−10, and·3.49 ∙ 10−10 for clear, hazy, and foggy weather conditions, respectively.

The effect of distance on signal and noise power is illustrated in Fig. 4 and 5. Noise power refers to the power of unwanted or random signals present in the proposed system. Noise power typically arises from various sources such as background radiation, electrical noise, or inter-ference from other devices. In the proposed vehicular model, the noise power arises from the presence of the artificial light source and both shot noise and thermal noise from the optical receiver. The relationship between noise power and link distance in OWC systems can be described by the inverse square law.


According to this law, with an increase in the link distance, there is a reduction in the received signal power, while the noise power remains relatively constant. This means that the SNR decreases with increasing link distance. This relationship implies that as the link distance increases, the noise power becomes relatively more dominant compared to the signal power leading to a decrease in the quality of the received signal. This is verified in our proposed model, where the signal power experiences an exponential decrease as the distance increases. For a distance of 80 m, the obtained signal powers are 11.22, 10.64, and 7.92 dBm for clear, hazy, and foggy atmospheric conditions. Referring to ( 6)–(8), the authors obtained the following results shown in Fig. 5.
Influence of the optical amplifier on the overall performance of the system
In this section, the impact of the amplifier gain of the optical amplifier on the Q-factor, signal power, and BER is discussed. In a VVLC system, an optical amplifier plays an important role on the receiving side to enhance the received optical signal strength and quality. The optical signal captured by the VVLC receiver may suffer from attenuation due to various factors such as distance, obstacles, and ambient artificial light sources. An optical amplifier helps in enhancing the signal power to compensate for the losses encountered during transmission.
By amplifying the weak received signal, the optical amplifier improves the SNR and enhances the overall system performance. Also, the optical amplifier can be used for extending the link distance enabling the vehicular system to cover large distances without degradation in the quality of the system.
Fig. 6 illustrates the correlation between the Q-factor and amplifier gain under various atmospheric conditions, considering a link distance of 80 m and a data rate of 25 Gbps. As shown, as the amplifier gain is increased, the Q-factor is increased. For a good performance for the proposed system under different weather conditions, it is better to choose an optical amplifier with an amplifier gain higher than 6 dB. With an amplifier gain of 6 dB, the obtained Q-factor is 8.38, 7.85, and 5.76 for clear, hazy, and foggy weather, respectively.

Figure 7 shows the relation between BER and amplifier gain at various atmospheric conditions with a distance of 80 m. The amplifier gain indirectly affects the BER performance of the system. A higher amplifier gain improves the SNR, which leads to a lower BER. However, excessively high gain levels can introduce non-linear effects and distortions, which may increase the BER. Therefore, optimizing the amplifier gain is essential to achieve the desired BER performance.

From Fig. 7, it is observed that as the amplifier gain is increased, the BER is decreased. For an amplifier gain of 6 dB, the obtained BER is 2.5 · 10−17, 2 · 10−15, and 4 · 10−9 for clear, hazy, and foggy weather, respectively. The obtained results for the BER are acceptable with this value of the amplifier gain as for enhancing the system perfor-mance, the BER should not exceed 10−9.
The influence of the amplifier gain on the signal power is shown in Fig. 8. As the gain of the amplifier is increased, the signal power is increased. For an amplifier gain of 6 dB, the obtained signal power was 13.22 dBm, 12.64 dBm, and 9.92 dBm for clear sky, hazy, and foggy weather, respectively.

Non-line of sight propagation model setup including an ambient artificial light source
Fig. 9 shows a scenario for the suggested NLoS-VVLC model with adding the effect of the artificial light source. As shown, the reflector functions as a receiver upon receiving a signal from the transmitting vehicle and subsequently operates as a transmitter when sending the signal to the receiving vehicle.

Table 5 illustrates the obtained results for the NLoS-VVLC proposed model by adding the effect of the artificial light source and the weather conditions.
Table 5.
Performance evaluation for the proposed NLoS model.
|
Clear weather |
Hazy weather |
Foggy weather |
LoS link distance (m) |
40 |
35 |
32 |
Q-factor |
6.058 |
6.58 |
6.18 |
BER |
6.83 · 10−10 |
2.34 · 10−11 |
3.16 · 10−10 |
Signal power (dBm) |
10.36 |
11.09 |
10.54 |
Noise power (dBm) |
−7.96 |
−7.96 |
−7.96 |
Total power (dBm) |
10.428 |
11.14 |
10.602 |
The total received optical power for the whole system can be written as
\( P_r^{\text {total }}=P_r^{L o S}+P_r^{N L o S} \) (12)
where 𝑃rtotal is the overall received optical power, 𝑃rLoS is the received LoS optical power, and 𝑃rNLoS is the received NLoS optical power.
The received LoS optical power is given by [22]
\( \begin{aligned} & P_r^{L o S} \\ & \quad= \begin{cases}\frac{I_t\left(\alpha_t, \beta_t\right) A_r}{(L E R) d^2} \cos (\varphi) \cos \left(\theta_i\right) ; & \text { if } 0 \leq \theta_i \leq \psi \\ 0 ; & \text { if } \theta_i>\psi\end{cases} \end{aligned} \) (13)
where 𝐼t(𝛼t,𝛽t) is the luminous intensity of the source and measured in candela (cd), 𝛼t is the vertical angle of the headlight, 𝛽t is the horizontal angle of the headlight, 𝐴r is the receiver effective area, 𝐿ER is the luminous efficacy of radiation of the source, 𝑑 is the distance between the trans-mitter and the receiver, 𝜑 is the emitting angle between source and receiver, 𝜃i is the incident angle between source and receiver, and 𝜓 is the receiver field of view (FOV).
The optical power received in the NLoS scenario can be represented as [22]
\( \begin{aligned} & P_r^{N L o s} \\ & = \begin{cases}\frac{I_t\left(\alpha_t, \beta_t\right) A_r A_R \cos \left(\theta_{R r}\right)}{(L E R) d_{R t}^2\left(d_{r R}^2+h_r^2\right)} \rho_R \cos \left(\varphi_{r R}\right) \cos \theta_{r R} ; & \text { if } 0 \leq \theta_{r R} \leq \psi \\ 0 ; & \text { if } \theta_{r R}>\psi\end{cases} \end{aligned} \) (14)
where 𝐴R is the reflector effective area, 𝜃R is the incident angle between reflector 𝑅 and receiver 𝑟 , 𝑑Rt is the distance between the transmitter and the reflector, 𝑑rR is the distance between the reflector and the receiver, ℎr is the height of the receiver, 𝜌R is the reflection factor of the reflector 𝑅, 𝜑rR is the emission angle between the reflector and the receiver, and 𝜃rR is the incident angle between the reflector and the receiver.
More analysis on obtaining the CIR can be found in Appendix A. Understanding the CIR helps in designing and optimizing the VVLC system for better performance. System performance can be studied using the derived CIR response to evaluate metrics such as BER, SNR, and data rate. This information is crucial for selecting appropriate modulation schemes, equalization techniques, and error correction coding techniques.
Performance evaluation for the proposed non-line of sight model
The influence of the LoS distance on the quality of the system, BER, signal power, and noise power is discussed in this section. Under various weather conditions and the impact of an ambient artificial light source, the maximum achievable LoS link distance is achieved. Fig. 10 illustrates the relation between the LoS link distance and the Q-factor for the NLoS-VVLC system. As illustrated, for clear weather, the maximum achievable LoS link distance is 40 m which produces a Q-factor of 6.058.
For LoS link distances higher than 40 m, the Q-factor degrades significantly with distance which degrades the performance of the proposed system. For hazy and foggy weather, the maximum attainable LoS link distance is 30 m which produces Q-factors of 7.61 and 6.61 for hazy and foggy weather, respectively.
Fig. 11 demonstrates the impact of the LoS link distance on the BER.

Clearly, the minimum acceptable BER for clear weather is 6.83 · 10−10 at a 40 m LoS link distance. For hazy weather, the minimum acceptable BER is 2.84 · 10−9 at a 40 m LoS link distance. For foggy weather, the minimum BER is 1.91 · 10−11 at a 30 m LoS link distance. Fig. 12 illustrates the impact of the LoS link distance on the signal power for different atmospheric conditions under the effect of an ambient artificial light source.

To ensure reliable communication, the received signal power should be above the receiver sensitivity threshold. The receiver sensitivity is the minimum power level required for the receiver to accurately detect and decode the transmitted signal. For the proposed model, it is noted that for clear weather conditions with a LoS link distance of 40 m, the obtained receiver sensitivity is 10.36 dBm. For hazy and foggy weather conditions with a LoS link distance of 30 m, the obtained receiver sensitivity is 12.37 and 11.13 dBm, respectively.
Fig. 13 displays the relation between noise power and LoS link distance. This relation can vary depending on the system design, environmental conditions, ambient light source, presence of a reflector, and the characteristics of the optical receiver. All these factors degrade the received signal power and increase the noise power. In the proposed system, as the LoS link distance increases, the noise power level generally remains almost constant, with a slight decrease.

Impact of optical signal power on system performance
The average optical signal power is typically deter-mined based on different factors in the proposed system such as modulation scheme, link distance, and sensitivity of the receiver. For achieving reliable communication between the transmitter and the receiver, it is essential to have an average optical signal power higher than the receiver sensitivity.
Environmental factors such as weather conditions, scattering, and interference from the ambient artificial light source can affect the average optical signal power. Also, as the link distance is increased, the average optical signal power is decreased.
For clear weather, the minimum acceptable average optical signal power is 7.22 dBm with a Q-factor of 6.05. For hazy and foggy weather conditions, the minimum acceptable average optical signal power is 8.23 and 7.6 dBm with Q-factors of 7.61 and 6.61, respectively.
Effect of optical amplifier and optical reflector on the system performance
The amplifier gain represents the amplification achieved by the optical amplifier, indicating how much the input optical power is increased by the amplifier. The optical gain can be expressed as
\( \text { Gain }(\mathrm{dB})=10 \log _{10} \frac{P_{\text {out }}}{P_{\text {in }}} \) (15)
where 𝑃in is the input optical power of the amplifier and 𝑃out is the output optical power of the amplifier.
In the proposed model, it is concluded that it is better to choose an optical amplifier with a minimum amplifier gain of 5 dB for better system performance. At this value, the obtained Q-factor is 7.377, 7.12, and 6.18 for clear sky, hazy, and foggy weather conditions, respectively. At this value, the obtained BER is 8.01 · 10−14, 5.2 · 10−13, and 3.16 · 10−10 for clear, hazy, and foggy weather, respectively.
The gain of the amplifier exerts a noteworthy influence on the signal power. As the amplifier gain is increased, the signal power is increased. At an amplifier gain of 5 dB, the obtained signal power is 12.09 dBm, 11.78 dBm, and 10.54 dBm for clear, hazy, and foggy weather conditions, respectively.
The reflector also has a great impact on the performance of the suggested system. The impact of the optical reflector on the Q-factor, BER, and signal power is explored. It is observed that the Q-factor is reduced with the increase of the attenuation of the optical reflector coefficient. The maximum acceptable attenuation coefficient which achieves an appropriate Q-factor for the various weather conditions is 5 dB. At this value, the Q-factor is 7.37, 7.12, and 6.18 for clear, hazy, and foggy weather, respectively.
The BER increases with the increase of the attenuation coefficient of the optical reflector. With an attenuation coefficient of 5 dB, the obtained BER is 8 · 10−14, 5.2 · 10−13, and 3.16 · 10−10 for clear, hazy, and foggy weather, respectively. Also, as expected, the output signal power diminishes as the attenuation coefficient increases. With an attenuation coefficient of 5 dB, the output signal power is 12, 11.7, and 10.54 dBm for clear, hazy and foggy weather, respectively. Table 6 illustrates the obtained results for the NLoS proposed model with an amplifier gain of 5 dB and an attenuation coefficient of 5 dB.
Table 6.
Performance evaluation for the NLoS model with an amplifier gain of 5 dB and an attenuation coefficient of 5 dB.
|
Q-factor |
BER |
Output signal power (dBm) |
Clear weather |
7.377 |
8.01 · 10−14 |
12.09 |
Hazy weather |
7.12 |
5.2 · 10−13 |
11.78 |
Foggy weather |
6.18 |
3.16 · 10−10 |
10.54 |
Conclusions
In this work, the performance of LoS and NLoS- VVLC systems with an ambient artificial light source and a reflector is investigated. The obtained results outline that LD-based VVLC system can provide higher data rates and longer link distances compared to LED-based ones. For the suggested LoS-VVLC system, the performance is improved with the use of the optical amplifier. Without optical amplifiers, the maximum attainable link distance is 45 m, 44 m, and 40 m, for clear sky, hazy, and foggy weather, respectively.
With the use of the optical amplifier, the corresponding maximum achievable link distance is 80 m, 80 m, and 70 m for clear, hazy, and foggy weather, respectively. It is better to use an optical amplifier with an optical gain of 5 dB for better performance of the proposed model. The impact of the link distance on the system metrics such as Q-factor, BER, and output signal power is studied for various weather conditions and under the impact of the artificial light source. For the proposed NLoS-VVLC model, a performance investigation has been performed by taking into account only the first-order reflection.
A practical channel environment is considered, taking under consideration the effect of the practically used ambient artificial light source as a noise source and reflector. The obtained results reveal that the CIR of the NLoS model has an exponential decay behaviour. The maximum achievable LoS link distance for the proposed NLoS system is 40 m, 35 m, and 32 m for clear, hazy, and foggy weather, respectively. The achieved Q-factor for these link distances is 6.058, 6.58, and 6.18, respectively. This result shows a good performance for the proposed model with the presence of an ambient artificial light source.
The results of the simulation showed that the output received signal power decreases with the increase in link distance and it varies between 22.37 dBm and 4.54 dBm for clear weather with a variation of the link distance from 10 m to 100 m. For hazy weather, the output received power varies from 22.2 dBm to 4.05 dBm for the same variations in the link distance and for foggy weather, it varies from 21.58 dBm to 1.98 dBm.
References
-
El-Mokadem, E. S., Tawfik, N. I., Aly, M. H. & El-Deeb, W. S. Design and performance evaluation of vehicular visible light communication system under different weather conditions and system parameters. Opto-Electron. Rev. 31, e145580 (2023). https://doi.org/10.24425/opelre.2023.145580
-
Zhu, X., Wang, C. X., Huang, J., Chen, M. & Haas, H. A novel 3D non-stationary channel model for 6G indoor visible light communication systems. IEEE Trans. Wirel. Commun. 21, 8292– 8307 (2022). https://doi.org/10.1109/TWC.2022.3165569
-
Priyanka. et al. Performance estimation of image transmission in indoor visible light communication system based on variable pulse position modulation. Int. J. Commun. Syst. 35, e5303 (2022). https://doi.org/10.1002/dac.5303
-
Karbalayghareh, M. et al. channel modelling and performance limits of vehicular visible light communication systems. IEEE Trans. Veh. Technol. 69, 6891–6901 (2020). https://doi.org/10.1109/TVT.2020.2993294
-
Turan, B. et al. Measurement based non-line-of-sight vehicular visible light communication channel characterization. IEEE Trans. Veh. Technol. 71, 10110–10114 (2022). https://doi.org/10.1109/TVT.2022.3181160
-
Eldeeb, H. B., Elamassie, M., Sait, S. M. & Uysal, M. Infrastructure- to-vehicle visible light communications: channel modelling and performance analysis. IEEE Trans. Veh. Technol. 71, 2240–2250 (2022). https://doi.org/10.1109/TVT.2022.3142991
-
Memedi, A. & Dressler, F. Vehicular visible light communications: A survey. IEEE Commun. Surv. Tutor. 23, 161–181 (2020). https://doi.org/10.1109/COMST.2020.3034224
-
Cervinka, D., Ahmad, Z., Salih, O. & Rajbhandari, S. A Study of Yearly Sunlight Variance Effect on Vehicular Visible Light Communication for Emergency Service Vehicles. in 12th International Symposium on Communication Systems, Networks and Digital Signal Processing (CSNDSP) 1–6 (IEEE, 2020). https://doi.org/10.1109/CSNDSP49049.2020.9249508
-
Matheus, L. E. M., Vieira, A. B., Vieira, L. F., Vieira, M. A. & Gnawali, O. Visible light communication: Concepts, applications and challenges. IEEE Commun. Surv. Tutor. 21, 3204–3237 (IEEE, 2019). https://doi.org/10.1109/COMST.2019.2913348
-
Tebruegge, C., Memedi, A. & Dressler, F. Empirical Characterization of the NLoS Component for Vehicular Visible Light Communication. in 2019 IEEE Vehicular Networking Conference (VNC) 1–4 (IEEE, 2019). https://doi.org/10.1109/VNC48660.2019.9062832
-
Varadarajan, V., Ashraf, K. & Ashok, A. Demo: Intelligent Vehicular Perception of Non-Line-of-Sight Environment Using Visible Light Communication with Stereo Cameras. in 2019 Vehicular Networking Conference (VNC) 1–2 (IEEE, 2019). https://doi.org/10.1109/VNC48660.2019.9062817
-
Dixit, V. & Kumar, A. Performance analysis of non-line of sight visible light communication systems. Opt. Commun. 459, 125008 (2020). https://doi.org/10.1016/j.optcom.2019.125008
-
Yahia, S., Meraihi, Y., Ramdane-Cherif, A., Ho, T. D. & Eldeeb,H. B. Enhancement of vehicular visible light communication using spherical detector and custom lens combinations. IEEE Access 11, 21600–21611 (2023). https://doi.org/10.1109/ACCESS.2023.3250397
-
Turan, B., Kar, E. & Coleri, S. Vehicular Visible Light Commu- nications Noise Analysis and Autoencoder Based Denoising. in Joint European Conference on Networks and Communications & 6G Summit (EuCNC/6G Summit) 19–24 (IEEE, 2022). https://doi.org/10.1109/EuCNC/6GSummit54941.2022.9815630
-
Guo, Y. et al. A tutorial on laser-based lighting and visible light communications: device and technology. Chin. Opt. Lett. 17, 040601 (2019). https://doi.org/10.3788/COL201917.040601
-
Qiu, P. et al. 4.0 Gbps visible light communication in a foggy environment based on a blue laser diode. Opt. Express 29, 14163– 14173 (2021). https://doi.org/10.1364/OE.427153
-
Tsai, C. T., Cheng, C. H., Kuo, H. C. & Lin, G. R. Toward high- speed visible laser lighting based optical wireless communications. Prog. Quantum Electron. 67, 100225 (2019). https://doi.org/10.1016/J.PQUANTELEC.2019.100225
-
Zaki, R. W., Fayed, H. A., Abd El Aziz, A. & Aly, M. H. Outdoor visible light communication in intelligent transportation systems: Impact of snow and rain. Appl. Sci. 9, 5453 (2019). https://doi.org/10.3390/app9245453
-
El-Nayal, M. K., Aly, M. M., Fayed, H. A. & AbdelRassoul, R. A. Adaptive free space optic system based on visibility detector to overcome atmospheric attenuation. Results Phys. 14, 102392 (2019). https://doi.org/10.1016/j.rinp.2019.102392
-
Siegel, T. & Chen, Sh.-P. Investigations of free space optical communications under real-world atmospheric conditions. Wirel. Pers. Commun. 116, 475–490 (2021). https://doi.org/10.1007/s11277-020-07724-1
-
Georlette, V. et al. Outdoor visible light communication channel modelling under smoke conditions and analogy with fog conditions. Optics 1, 259–281 (2020). http://doi.org/10.3390/opt1030020
-
Farahneh, H., Hussain, F. & Fernando, X. Performance analysis of adaptive OFDM modulation scheme in VLC vehicular communication network in realistic noise environment. EURASIP J. Wirel. Commun. Netw. 2018, 1–15 (2018). https://doi.org/10.1186/s13638-018-1258-3
-
Yanikgonul, S. et al. Integrated avalanche photodetectors for visible light. Nat. Commun. 12, 1834 (2021). https://doi.org/10.1038/s41467-021-22046-x
