City lights revolution: Next-gen optical fibre for smart cities
- Department of Medical Device Technology Engineering, Al Mustaqbal University, Babylon, Iraq
- Department of Computer Techniques Engineering, Imam Al Kadhum College (IKC), 10087, Baghdad, Iraq
Article Info
Received 07 Apr. 2024
Received in revised form 03 May 2024
Accepted 06 May 2024
Available on-line 29 Jul. 2024
Keywords: dynamic traffic conditions; BER; vehicular communication channel model; visible light communication.
Abstract
In the rapidly evolving landscape of smart cities, the integration of advanced technologies is crucial for ensuring safety, optimizing traffic flow, and enhancing the urban living experience. Vehicle-to-vehicle (V2V) communication and visible light communication (VLC) have emerged as promising solutions to address these challenges. This paper explores the integration of V2V communication and VLC at smart pedestrian crosswalks to enhance pedestrian safety and traffic management in smart cities. It explores the impact of neighbouring vehicles on V2V-VLC performance and proposes novel methodologies to assess traffic density effects. Results indicate a significant chance of encountering nearby cars during rush hours, emphasizing the importance of these integrated systems for safety and mobility in urban environments. The outcomes show that the chance of running into extra cars in nearby lanes is independent of the particular lane and increases to 80% through rush hours, but falls to a lower amount than 20% through off-peak and initial morning hours.
Introduction
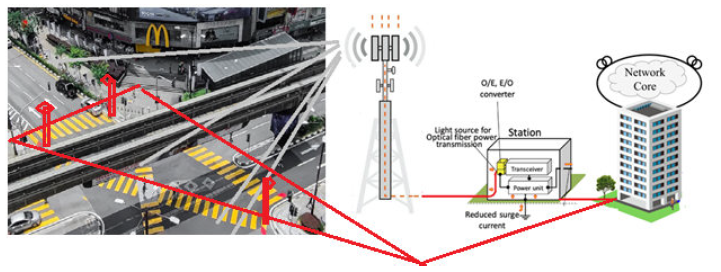
Advanced and networked technologies that solve safety issues, maximize traffic flow, and enhance the urban living experience overall are critical in a quickly developing field of smart cities. By enabling real-time information transmission between vehicles, including position, speed, and hazard alerts, vehicle-to-vehicle (V2V) communi-cation has already shown promise in improving road safety [1-3]. At the same time, visible light communication (VLC) has gained attention as a complementary communi-cation technology that employs visible light signals for short-range, high-data-rate transmission [4-6]. In a smart city environment, where connectivity and data sharing are fundamental, the integration of V2V-VLC systems holds the promise of providing precise and localized communi-cation, particularly at vulnerable locations like crosswalks as shown in Fig. 1. Smart crosswalks are key components of modern urban infrastructure, aimed at safeguarding pedestrian and cyclist movements across busy roadways [7–9].
The combination of V2V-VLC systems with smart crosswalks not only enhances pedestrian safety but also contributes to the efficient management of traffic and transportation within the city [10, 11]. Much attention was gained by various multiple-input and multiple-output (MIMO) and diversity systems where the communication was significantly improved by using various multiport antenna systems. It was demonstrated that such systems can provide better communication within many complex propagation environments [12-14]. In the context of modern smart cities, improving pedestrian safety and enhancing traffic management have become paramount objectives. V2V communication systems have gained significant attention for their potential to increase road safety and traffic efficiency [15, 16]. This integration harnesses the potential of V2V-VLC technology to provide precise and localized communication, especially in areas where the safety of pedestrians and cyclists is a primary concern, such as at crosswalks [17, 18]. The key advantages and implications of this integration are smart crosswalks equipped with V2V-VLC systems that offer real-time communication between pedestrians and approaching vehicles [19]. This enables pedestrians to receive signals on their smartphones or wearable devices, informing them when it is safe to cross the road. This direct and instantaneous communication significantly reduces the risk of accidents and enhances pedestrian safety [20].
V2V-VLC technology integrated into smart crosswalks can transmit data to nearby vehicles [21]. These data can include information about pedestrian presence, crossing intentions, and estimated crossing times. Vehicles can use this information to adapt their speed and behaviour, contri-buting to a smoother traffic flow and reduced congestion around crosswalks [22]. The integration of V2V-VLC at crosswalks is a significant step in reducing accidents involving vulnerable road users. It addresses the common scenario of drivers failing to notice pedestrians in time, especially in low-light conditions. The technology increases visibility and awareness, potentially saving lives. The combination of V2V-VLC systems and smart crosswalks not only enhances safety, but also contributes to the efficient and interconnected nature of modern urban environments [23-25].
As cities continue to embrace smart city initiatives, technologies like V2V-VLC become essential tools for ensuring safe and convenient mobility for all residents and visitors. VLC makes use of existing streetlights, traffic signals, as well as headlights and taillights of vehicles to exchange data about traffic patterns among cars and to communicate with structures. Moreover, owing to the focused emission of sources of light, VLC experiences reduced interference in comparison to the radio frequency (RF) technology [26–28]. The dynamic nature of vehicular communication systems contributes to the increased likelihood of interruptions in VLC links, primarily due to interference and reflection from neighbouring cars in adjacent corridors. The presence of artificial light sources interfering with these neighbouring cars lighting which are artificially illuminated in nearby cars amplifies the pot-shot noise [29].
Additionally, light that is reflected from cars in adjacent paths scatters the pulses of the signal received, thereby introducing an issue of inter-symbol interference, which restricts the achievable information rates. Therefore, it is crucial to examine the statistical aspects of the presence of extra cars in those adjacent paths. In the following section, the authors present associated studies that have explored the consequences of reflection, as well as interference from both ordinary and unnatural foundations for automobile VLC (AVLC) systems [30]. This paper presents an innovative approach to designing and deploying road-side communication (RSC) systems based on VLC in smart cities. VLC uses visible light signals for communication between vehicles and infrastructure elements, offering several advantages, including high-data-transfer rates, low latency, and reduced interference with existing RF networks. The RSC system integrates VLC with pedestrian crosswalks, providing an additional layer of safety for both pedestrians and drivers.
In Fig. 1, by installing optical fibre cables near or underneath crosswalks, a robust and reliable communi-cation infrastructure is created that can support the demanding requirements of VLC systems, ensuring that data are transmitted quickly, securely, and without interference. This infrastructure is essential for enhancing pedestrian safety, improving traffic management, and supporting the broader goals of a smart city, as well as a the installation of light-emitting diode (LED) lights, embedding LED lights (red colour) in the crosswalk itself. Also, in this research paper, the authors begin by introducing a novel structure for a V2V-VLC system, designed to meet the requirements of outdoor VLC applications. They assess the performance of the standalone VLC system by addressing crucial factors like signal-to-noise ratio (SNR), power consumption, and bit error rate (BER) associated with each modulation technique used. Subsequently, the authors propose an innovative hybrid system that integrates VLC and RF communication to tackle the challenges encountered by the standalone VLC system.
Related works
The authors of Ref. 31 are researchers or scientists who conducted a study related to improving the efficiency of selected combined receivers in outside VLC systems. VLC is a technology that uses visible light to transmit data wirelessly. In Ref. 32 a study was conducted to investigate the effect of solar irradiance on VLC. The paper presents their research findings, methodology, and analysis regarding how changes in solar irradiance (sunlight) impact the performance of VLC systems. Reference 33 describes a research related to VLC systems, specifically focusing on the challenges of maintaining efficient communication when either natural or artificial lighting is present. The authors in Ref. 34 conducted a research to investigate the impact of annual solar variation on the VLC systems of emergency service vehicles. The authors in Ref. 35 carried out studies to investigate how interference affects the effectiveness of VLC in a vehicle company. This paper focuses on two key performance metrics in VLC systems, BER and SNR. References 36 and 37 used a geometry-based analytical approach to investigate the V2V-VLC channel. In Ref. 38, the study explored the result of a light reflected of roadway pollutants and surfaces, however, it used a headlight beam pattern made of tungsten halogen, which would not be appropriate for V2V-VLC systems using LED light sources. The findings revealed that wet roads amplified the power obtained from reflections, thereby extending the transmission distance. Reference 15 served as the basis for the research in Ref. 16, which aimed to enhance the data transmission rate of V2V-VLC links through the use of the MIMO technology.
Nevertheless, it is important to note that these studies did not take into account reflection from neighbouring cars, which can be an important factor, especially in busy traffic circumstances. The research presented in Ref. 39 was expanded in Ref. 40 to take into account the fact that headlight irradiation pattern of an automobile is not uniform. The present study used an ellipsoid and a sphere as part of a 3D geometry-based stochastic model (GBSM) to explain the properties of the V2V-VLC channel. The outcomes underscored the significance of taking into consideration the 3D radiation arrangement of a car lighting. The research covered in Ref. 41 underlined how important interference is for each VLC, as well as RF systems operating in high-traffic-density situations.
According to Ref. 41, VLC experiences the minimal interference and has a restricted transmission range. Consequently, the research proposed the use of a hybrid vehicular ad-hoc network (VANET) incorporating both VLC and RF technologies. VLC technology was chosen for a wide bandwidth, good power effectiveness, as well as low reflecting, making it ideal for integration, but RF was included to increase the range of transmission. Regarding Ref. 42, the research focused on the use of VLC technology to address issues related to interference and latency in RF-based V2V schemes, particularly in high-traffic-density scenarios. The study suggested the dual use of VLC technology for both communication and distance estima-tion purposes. Similarly, the research discussed in Ref. 43 investigated the power that was received in the dynamic V2V-VLC channels using the GBSM, considering each straight line-of-sight (LOS) signals and reflections from neighbouring cars. The study revealed that changes in the relative speeds of vehicles had a more substantial impact on the power of reflected signals compared to the LOS signals.
Furthermore, the received power that was gener-ated by the LOS element was more dependent on the vehicle movement direction compared to the light reflection element power. It is important to note that vehicle -visible light communication (VVLC) systems are influenced by various factors, including the radiation pattern, weather conditions, interference from artificial and natural light sources, traffic conditions, coating and colour of vehicles, as well as the condition of road surfaces (whether they are wet or dry). Nonetheless, these factors are largely independent of each other. Therefore, to create a comprehensive model that accounts for the combined effects of these independent variables, it is necessary to consider their individual impacts.
The influence of the light radiation pattern on VLC was explored in Ref. 44, in which it was suggested to use mathematical models to describe the radiation patterns of headlamps made by various companies and styles. Further-more, in Ref. 45, the effects of different kinds of weather, as well as glaring reflections from the roadway and surrounding cars were discussed. According to the research, attenuation brought about by unfavourable weather conditions (such as thick fog) is not nearly as important as the propagation path loss caused by differences in distances of multiple vehicles. Furthermore, because various surfaces have a comparatively small reflectivity, the effect of reflections from road lighting was negligible in comparison to reflections form automobiles. Thus, reflections of neighbouring cars in adjacent paths, as well as dynamic characteristics of the VVLC channel in response to traffic changing conditions at various times of each day are the main subjects of this research. The impact of reflection and interference on the V2V-VLC route was already acknowl-edged by earlier study. Nevertheless, although the existence of cars in neighbouring sectors could have a major impact on the degree of reflections, as well as interruption observed in VVLC structures, it is important to note that not one of the aforementioned studies included statistical evaluation related to this component.
Motivation and unique contribution
In the V2V-VLC link, nearby cars with very bright exteriors act as the closest reflective elements. Further-more, a shot noise is additionally introduced by lighting sources of adjacent cars [23-25]. Nevertheless, the compo-sition of nearby cars fluctuates with traffic flow due to the constantly shifting conditions of traffic which change throughout the day. Therefore, the authors are motivated to use an actual traffic measurement information to evaluate the effect of reflection and interference of nearby cars in adjacent zones and to investigate their influence upon V2V-VLC efficiency at various times of the day. This invention could prevent traffic jams, save lives, and contribute to the authors’ goal of building fully automated networked smart cities. Fig. 2 illustrates the effective-ness of the advanced communication system combining optical fibre networks and vehicle communication links to improve road safety and efficient traffic management.

Some of the primary advances made in this article can be summarised as follows:
- Using traffic measurements to determine the likelihood of nearby cars being in neighbouring lines. This is expected to be crucial in determining how effective automotive communication technologies are.
- Investigating LOS, as well as non-line-of-sight (NLOS) aspects of the V2V-VLC channel.
- Evaluating how V2V-VLC channel efficiency in terms of BER and SNR is affected by varying traffic density in various sectors
The architecture of systems
The receiving signal, y(t), in optical networks for communication may be explained in the following manner:
\( y(t)=x(t) * h(t)+n(t) \) (1)
where y(t) is the signal that has been obtained x(t), is the transmitted optical signal. The channel impulse response, or h(t), shows how the channel affects the optical signal, considering any attenuation, dispersion, and other channel properties, and n(t) denotes the amount of noise present in the route which can be regarded as additive white Gaussian noise (AWGN).
The fundamental paradigm of optical communication is represented by this equation, in which the received signal consists of the broadcast signal plus noise and channel effects. Depending on the specific characteristics of the optical communication system and the channel circum-stances, h(t) and n(t) can have different specific forms. The overall noise variance, or σT2, in optical communication systems is usually the combined amount of two primary noise elements, shot noise (σshot2) and thermal noise (σth2). The following is the equation for the total amount of noise variance
\( \sigma_T^2=\sigma_{s h o t}^2+\sigma_{t h}^2 \) (2)
The amount of noise is represented by the variable σshot2, which results from the random reception of photons in the optical detection. It is proportional to the square root of the received optical power and is a key source of noise in optical systems for communication. The thermal noise in the receiver electronics is represented by the symbol σth2, which results from thermal agitation of electrons. It fre-quently occurs independently of the received optical power and is commonly represented as AWGN.
The efficiency of the optical communication system, containing metrics as BER and SNR, is examined using this formula which represents the overall noise power in the overall system. The features of the optical receiver, as well as the system as a whole architecture determine the precise values for σshot2and σth2.
The formula for the thermal noise variance, σth2 is shown below:
\( \sigma_{t h}^2=8 \pi K_{\mathrm{B}} T_{\mathrm{K}} C_{\mathrm{pd}} A_{\mathrm{r}} I_2 2 B_w G_v+16 \pi^2 K_{\mathrm{B}} T_{\mathrm{K}} \Gamma C_{\mathrm{pd}}^2 A_{\mathrm{r}}^2 I_3 B_w^3 g_m \) (3)
The parameters in (3) are broken down as follows:
KB is the Boltzmann constant, TK: temperature in Kelvin, or the temperature in absolute terms, Cpd is the photo-diode fixed capacitance over area of the unit, Ar: the recipient active region, I2 and I3: the band-width factors of noise, Bw: the band-width of noise, Gv: the amount of voltage gains in an open-loop, Г: the noise parameter of the field-effect transistor (FET) channels, and gm: the transconductance of FETs.
This formula offers a thorough explanation of the thermal noise variance in an optical communication system, accounting for a number of receiver-related aspects, as well as photodiode and amplifier properties. In optical communication systems, it is a crucial part of the total noise variance.
The primary causes of ambient noise (also known as shot noise) in V2V-VLC systems are nearby cars, artificial and daylight light sources. Ambient light-induced shot noise can be computed as follows:
\( \sigma_{s h o t}^2=2 Q\left(E_r+L \cdot E_I\right) \gamma B_w+2 Q I_{b g} I^2 B_w \) (4)
where Q is the charge of electrons, Er: the acquired energy, L: the likelihood that additional cars will be in the nearby roadways, EI is the car interference energy for nearby roadways, Ibg: the light-induced current from surrounding generators
During V2V-VLC, the power received is generally a linear combination of the power generated by NLOS, as well as LOS pathways. It is calculated as follows:
\( E_r=E_T * H(0) \) (5)
where ET is the transmitted energy, H(0) is the integral of a channel response to impulses (H(0) = ∫h(t)dt+∞-∞ and h(t) represents the DC channels gain).
This receiver SNR may be written as follows:
\( \operatorname{SNR}=\left(\frac{\gamma^2 \times E_T^2}{\sigma^2 T}\right) \) (6)
where γ is the factor for coefficients, Er is the acquired energy, σT2 is the variance across all noise.
On-off keying (OOK) modulation is widely used in V2V-VLC devices that make advantage of direct detection/intensity modulation (DD/IM) techniques. Both background noise and LED non-linearity distortion can be tolerated by using this modulation method. Using OOK modulation, the system BER may be computed in the following manner:
\( \mathrm{BER}=Q(\sqrt{\mathrm{SNR}}) \) (7)
where Q(y) is the common notation in the likelihood theory, representing the Q-function.
Equations (5), (6), and (7) highlight the importance of the DC channel gain in assessing and understanding the communication efficiency of V2V-VLC systems. One important metric that is essential to the system evaluation is the DC channel gain, or H(0). Its significance within these equations is summarised as follows: in equation (5) the transmitted energy (ET) and the DC channels gain [H(0)] are precisely proportional to the energy received (Er). The DC channel gain indicates the properties of the channel and establishes how the optical signal is impacted by the medium of transmission. It plays a crucial role in figuring out the received power.
Equation (6) is the SNR: the crucial indicator of the efficiency of a system for communication. The SNR is inversely related to the overall noise variance (σT2) and impacted by the square of the energy received (Er2). The energy that is received is influen-ced by the DC channel gain H(0) and this directly impacts the SNR. In equation (7) the square root of the SNR defines the BER, the measurement of communication efficiency. The DC channel gain has an indirect effect on the BER because the SNR depends on the received power. A thorough comprehension of the DC channel gain is essential for forecasting and BER optimization. In conclusion, the DC channel gain H(0) is critical for describing the behaviour of the V2V-VLC channels, as well as for evaluating the communication system efficiency.
This is a key metric for maximizing the power efficiency and error rate of the system and offers insightful infor-mation about how the transmission medium affects the optical signal. According to Table 1 data, several statistical distributions have been applied to simulate other cars sharing adjacent lanes with two paths at particular time intervals (00:00–03:00, 03:00–06:00, 06:00–09:00, and 16:00–19:00). The most common mistake: principles from the distribution factors are used to evaluate the quality of the fit for various distributions; smaller standard error values signify more favorable matches. The most important results are in Table 1. It is possible to characterise the V2V-VLC channel gain by looking at the car headlight radiation patterns.
Table 1.
(a, b, c, d) Parameters of various distributions which should be able to explain L, as well as D.
(a)
Time |
Lane |
Distribution |
Parameters of L |
||||
Mean value (m) |
μl |
μl Estimation error (%) |
δl |
δl Estimation error (%) |
|||
00:00 – 03:00
03:00 – 06:00
06:00 – 09:00 |
Left (1) |
Log-normal |
3.74 |
1.21 |
0.41 |
0.46 |
0.29 |
Middle(2) |
2.55 |
0.78 |
0.98 |
0.56 |
0.69 |
||
Left (1) |
Nakagami |
3.7 |
1.56 |
1.8 |
16.2 |
11.67 |
|
Middle(2) |
2.6 |
0.94 |
2.0 |
8.7 |
15.7 |
||
Left (1) |
Normal |
3.7 |
3.7 |
1.4 |
1.6 |
1 |
|
Middle(2) |
2.5 |
2.5 |
2.6 |
1.5 |
1.8 |
||
Left (1) |
Exponential |
3.7 |
3.7 |
3.3 |
-- |
-- |
|
Middle(2) |
2.5 |
2.5 |
4.4 |
-- |
-- |
||
(b)
Time |
Lane |
Distribution |
Parameters of D |
||||
Mean value (m) |
μd |
μd Estimation error (%) |
δd |
δd Estimation error (%) |
|||
|
Left (1) |
Log-normal |
57.2 |
3.72 |
0.45 |
0.80 |
0.32 |
00:00 – 03:00 |
Middle(2) |
|
67.1 |
3.82 |
0.44 |
0.87 |
0.31 |
Left (1) |
Nakagami |
62.1 |
0.5 |
0.33 |
6032 |
4844 |
|
03:00 – 06:00 |
Middle(2) |
|
73.3 |
0.45 |
0.26 |
8770 |
6630 |
Left (1) |
Normal |
1 |
57.2 |
29.8 |
52.3 |
21 |
|
06:00 – 09:00 |
Middle(2) |
|
1.8 |
57.1 |
33.2 |
65.3 |
23.4 |
Left (1) |
Exponential |
57.5 |
57.5 |
32.7 |
-- |
-- |
|
|
Middle(2) |
|
67.1 |
67.1 |
34.1 |
-- |
-- |
(c)
Time |
Lane |
Distribution |
Parameters of L |
||||
Mean value (m) |
μl |
μl Estimation error (%) |
δl |
δl Estimation error (%) |
|||
16:00 – 19:00 |
Left (1) |
Log-normal |
19.9 |
2.7 |
0.30 |
0.70 |
0.25 |
Middle(2) |
16.7 |
2.4 |
0.35 |
0.87 |
0.20 |
||
Left (1) |
Nakagami |
19.3 |
0.73 |
0.38 |
515 |
262 |
|
Middle(2) |
15.9 |
0.58 |
0.28 |
380 |
205 |
||
Left (1) |
Normal |
18.9 |
18.9 |
5.4 |
12.5 |
3.8 |
|
Middle(2) |
15.6 |
15.6 |
4.5 |
11.7 |
3.9 |
||
Left (1) |
Exponential |
18.9 |
18.9 |
8.27 |
-- |
-- |
|
Middle(2) |
15.6 |
15.6 |
6.4 |
-- |
-- |
||
(d)
Time |
Lane |
Distribution |
Parameters of L |
||||
Mean value (m) |
μd |
μd Estimation error (%) |
δd |
δd Estimation error (%) |
|||
19:00 – 19:00 |
Left (1) |
Log-normal |
7.8 |
1.35 |
0.45 |
1.18 |
0.31 |
Middle(2) |
3.9 |
0.81 |
0.42 |
1.05 |
0.29 |
||
Left (1) |
Nakagami |
11.9 |
0.2 |
0.1 |
325 |
256 |
|
Middle(2) |
8.3 |
0.2 |
0.09 |
169 |
148 |
||
Left (1) |
Normal |
8.6 |
8.6 |
6 |
15.8 |
4.2 |
|
Middle(2) |
5.1 |
5.1 |
4.8 |
11.9 |
3.4 |
||
Left (1) |
Exponential |
8.6 |
8.6 |
3.27 |
-- |
-- |
|
Middle(2) |
5.1 |
5.1 |
2 |
-- |
-- |
||
Cars with close spacing and heavy traffic use low-beam headlights. Fig. 3 presents a diagram showing the relationship between high-beam and low-beam patterns projected onto the road area. Fig. 3 shows the optical signal propagation paths that are in LOS and beyond NLOS between the transmitting car A and the receiving car B. Equation (10) gives a DC gain in the channel for a Lambertian source in the LOS path:

\( H_{\mathrm{LOS}}(0)=\frac{A_{\mathrm{r}}(m+1)}{2 \pi D^2} \cos ^m(\phi) \) (8)
In this case, ϕ is the irradiance angle at the photodetector (PD), D is the intra-vehicular distance, and
\( m=-0.6931 \ln \left(\cos \left(\Psi_2\right)\right) \) (9)
is the Lambertian order, and Ψ2 is the electromagnetic radiation half-power angle. The angular distribution of the asymmetric radiation intensity pattern of low-beam illumination is illustrated by an empirical radiation simulator of the source used in this study that relies upon data from Ref. 29. Therefore, the LOS channel pathway loss (in dB) remains expressed in (10):
\( P_{\mathrm{LOS}}=\alpha+\delta-10 \beta \log _{10}(D+1)+\omega \cos (2 \pi(\phi+90)) \) (10)
The nonlinear least square approach is used to derive the values of the constants (α = 695.3, δ = −717.3, β = 4.949, and ω = 63.13) using empirical observations of vehicle headlights. Equation (11) provides the channel gain resulting from reflectors when considering Lambertian diffuse reflection on the car surface.
\( H_{\text {refl }}(0)=\frac{1}{2 \pi r_j^2} \sum_{J=1}^N \rho H_{\text {LOS } J}(0) \cos \left(\phi_J^S\right) \cos \left(\theta_J^R\right) \) (11)
In this case, N is the entire sum of reflectors, rj is the length of the path from the j-th reflector to the recipient, ρ is the measure of reflection on the reflection surface, ϴJR equals the angle of incidence of the recipient, as well as ϕJS denotes the degree of irradiation in relation to a typical reflector. HLOSJ(0) symbolizes the LOS DC channel gain via the j-th reflector source. The energy obtained via reflections is represented by the following symbol:
\( P_{\text {refl }}=P_T L H_{\text {refl }}(0) \) (12)
In this article, the authors use traffic data to determine the likelihood of multiple cars sharing neighbouring paths. They identify the existence of cars by analysing traffic flow then information on road occupancy.
In order to calculate the likelihood of several cars sharing the roadway, the authors first define the event “fk”. This event indicates that there are more cars in the k-th lane than there are in the left side, centre, and right roadways, correspondingly (k = 1, 2, or 3). If there are many vehicles present in the k-th lane (flow k), one assigns an amount of 1 to event fk; alternatively, one assigns a value of 0. Next, one computes event Rk which indicates that there are two or more cars in any of the two lanes. The results are shown below:
\( \text { Lane 3 }=R k \times\left(O_2+O_1\right) / 2 \) (13)
\( \text { Lane } 2=R k \times\left(O_3+O_1\right) / 2 \) (14)
\( \text { Lane } 1=R k \times\left(O_3+O_2\right) / 2 \) (15)
The distribution of the likelihood of having vehicles sharing the neighbouring lanes ( Lk) can then be used to compute the distribution characterising the likelihood of more cars coexisting in nearby roads. According to predetermined events, road occupancy percentages, and traffic flow data, the likelihood of several cars in adjacent lanes is computed. For the purpose of assessing and comprehending traffic situations on multi-lane roadways, these data are invaluable. Using the parameters listed in Table 2, a V2V-VLC link was simulated, and SNR and BER efficiency were evaluated. To evaluate how changes in channel loss of path during the day affect the communication link, the effectiveness of BER was assessed in relation to the transmit SNR. In VLC, it is customary to assess the system effectiveness by means of the transmit SNR, particularly in situations where the channel impulse response is fluctuating [33].
Table 2.
Simulation parameters.
Symbol |
Parameter |
Values |
Ar |
Receiver area |
1 · 10−4 m2 [3] |
ψc |
Receiver field of view |
80° [3] |
ϒ |
Pd responsivity |
0.54 A/W [39] |
ϕc |
Semi-angle |
30° [23] |
PT |
Transmitted power |
1W |
Bw |
Noise bandwidth |
100 MHz [11] |
Ƿ |
Reflection coefficient |
0.8 [3] |
The formula for calculating the transmit SNR is as follows:
\( \mathrm{SNR}_t[\mathrm{~dB}]=\left(\frac{\gamma^2 H(0)^2 P_{\hat{T}}}{\sigma_T^{\hat{T}}}\right)-10 \log \left(H(0)^2\right) \) (16)
In (16), SNRt values in dB are adjusted based on the consistent channel pathway loss values [24]. A transmitter car and a receiver car were used in the simulation; their intravehicular distance D changed depending on where they were positioned in different lanes and at different times of the day (as shown in Table 1). The communication link was affected by the presence of two potential reflectors/interfering vehicles (j = 1 and 2) on nearby roads situated at coordinates (xj, yj), as shown in Fig. 2. A well-implemented VLC system will have a low BER indicating that data transmission is highly reliable. This means that the transmitted data are received with minimal errors.
Numerical results
Nevertheless, the authors only considered two lanes in their analysis – the hard shoulder was not included. When comparing the statistics of the two highways in this specific dataset, no differences were identified. Consequently, in order to increase each model generalization, they were averaged. In order to simulate the existence of other cars in the neighbouring roads for the two sides throughout four time periods – 00:00–03:00, 03:00–06:00, 06:00–09:00, as well as 16:00–19:00 – Table 1 gives factors for alternative distributions. In order to reduce estimation errors, the adequacy of the distribution fit is evaluated using standard error values associated with the distribution factors. The following Table 1 shows that the log-normal distribution has the smallest standard error values and the closest fit to the coexistence of other cars in neighbouring lanes when compared to the normal, log-normal, Nakagami, and exponential distributions. As a result, this distribution may be used to calculate the likelihood of other cars sharing the neighbouring paths.
\( P_L(l)=\frac{1}{\delta_l \sqrt{2 \pi}} \frac{1}{l} \exp \left(-\frac{\left(\ln (l)-\mu_l\right)^2}{2 \delta_l^2}\right) \) (17)
The numerical values for the distribution parameters μl and δl are given in Table 1. Fig. 4 shows the fitting of the cumulative distribution function (CDF) curve for the likelihood of other cars in adjacent paths for the following time periods: 6:00 AM to 9:00 AM, 4:00 PM to 7:00 PM, and midnight to 3:00 AM. The aforementioned curves unequivocally show that the log-normal distribution fits the data nicely. The information provided in Table 1shows that, for each of the paths at particular time periods, the likelihood of cars coexisting in adjacent lines is quite equal. However, there is a substantial difference in the mean values across the four time periods. The mean values range from 4.11% to 2.89% during off-peak hours and increase to the range from 20.9% to 15.3% during rush hours. The results presented here show a considerable variation in the likelihood numbers between peak and off-peak times, albeit most of these numbers do not go over 20% and 60% for 00:00–03:00, 03:00–06:00, 06:00–09:00, and 16:00–19:00, respectively.


The most significant finding is the substantial difference in the mean values across the four time periods. During off-peak hours (midnight to 3:00 AM and 3:00 AM to 6:00 AM), the mean values range from 4.11% to 2.89%. However, during rush hours (6:00 AM to 9:00 AM and 4:00 PM to 7:00 PM), the mean values increase to the range from 20.9% to 15.3%. This suggests that there is a notable variation in the likelihood of coming across other cars in nearby lanes during peak and off-peak hours. The information indicates that there is a discernible difference between rush and off-peak hours in terms of the likelihood of running over automobiles in nearby lines. The likelihood numbers significantly increase during rush hours, suggesting a higher likelihood of coexisting with other vehicles in adjacent lanes during these time periods. Despite the fluctuation in mean values, it is observed that most of the aforementioned likelihood values for the corresponding time intervals are not above 20% during off-peak hours, as well as 60% during rush hours.
This provides a range within which the probability of encountering other vehicles decreases and can be used for planning and modeling purposes, and also that there is a significant fluctuation in the likelihood of encountering other cars in nearby paths between rush and off-peak hours, with a higher likelihood during rush hours. The log-normal distribution is a suitable model for describing this phenomenon, the likelihood that additional cars may coexist in the nearby paths Lk. As shown in (5), (10), and (11), examining inter-vehicular lengths is essential to dermine the channel gain and the received energy of the V2V-VLC link.
Inter-vehicular distances are subject to continuous fluctuations, primarily driven by dynamic variations in traffic density throughout different times of the day and within different lanes. Similar to the analysis conducted for the authors, they used a CDF curve fitting technique to represent inter-vehicular ranges using exponential, log-normal, normal, as well as Nakagami distributions. The presence of additional cars led to traffic density throughout different times of the day and within different lanes. It is crucial to identify the pattern of distribution which most closely approximates inter-vehicle distances. The mean and standard error estimates for four distributions in each of the two channels for the hours of 00:00–03:00, 03:00–06:00, 06:00–09:00, as well as 16:30–19:30 are compiled under Table 1. The range of values with the lowest prediction error number is known as the log-normal one, as Table 1 shows it. This finding is consistent with the findings in the scientific literature that has been published to date, which has revealed that inter-vehicle distances are closely approximated by the log-normal distribution [35-37]. Therefore, the distribution for inter-vehicular distances is appropriately characterised by the log-normal distribution.
\( P_D(d)=\frac{1}{\delta_d \sqrt{2 \pi}} \frac{1}{d} \exp \left(-\frac{\left(\ln (d)-\mu_d\right)^2}{2 \delta_d^2}\right) \) (18)
Table 1 provides the distribution parameters μd and δl. Fig. 5 illustrates the CDFs of inter-vehicular distances, assuming two pathways over four different time periods together using log-normal distribution. Intervals: 00:00–03:00, 03:00–06:00, 06:00–09:00, and 16:00–19:00.

The BER efficiency for LOS and NLOS components – which do not include the LOS signal – that are reflected from cars in neighbouring paths is shown in Fig. 6. The data show notable differences in BER efficiency between lanes. This is anticipated given that, as summarised in Table 1, the transmission distances in these paths have unique lane-dependent average values. The left-hand lane (Lane 1) has the smallest transmission distance within off-peak hours (06:00–09:00), with a mean value of 50.2 m, while the right-hand lane (Lane 2) has the longest inter-vehicular distances (60.1 m). For a result, the pathway on the left (Lane 1) has the maximum SNR and the least path loss. As a result, this lane BER values are smaller than those of the right-hand lane (Lane 2).
For instance, the BER values of the LOS link for the left-hand lane (Lane 1) and the right-hand lane (Lane 1), accordingly, are 0.0703 and 0.0652 at SNR = 15 dB. Additionally, the left-hand lane (Lane 1) has lower BER rates of the NLOS element than the right-hand lane (Lane 2). For example, for SNR = 30 dB, the BER values of the NLOS connections are 0.69 and 0.77 for the left-hand lane (Lane 1) and the right-hand lane (Lane 2). The NLOS component adequate performance is also anticipated because there is a significant likelihood of automobiles coexisting in nearby lanes – up to 90% – suggesting an increased likelihood of reflection events. Additionally, Fig. 6 demonstrates that in order to attain comparable BER numbers, different SNR ranges are needed, ranging from 35 dB during off-peak hours to 15 dB during rush hours. This demonstrates how channel capacity fluctuates and depends on traffic patterns at various times of each day.

The graphs also analyse the BER efficiency of the V2V-VLC system throughout the range of transmitted SNR numbers, from 0 to 35 dB, which is comparable to the results reported in Ref. 38, where the transmission distance was not more than 5 m and the transmitted SNR ratings ranged from 80 to 240 dB for an interior environment. The required lighting level determines the transmit SNR. A few examples of the variables that affect the real SNR are information rate, optical gain, optical filters, as well as transmitter and receiver technologies. Nevertheless, the transmitted energy is constant to satisfy lighting restrictions which implies that SNR at the transmitter is fixed for a particular system. As a result, the BER values vary with the transmit SNR.
This is a prevalent issue in mobile communication networks and different methods are used to guarantee what is needed for transmission, including adaptive data rate, rate-adaptive modulation, and automatic gain control [39]. The SNR values at the transmitter that are required to attain a BER of 10−6 under a variety of circumstances, such as distinct paths and propagation pathways, are listed in Table 3. Table 3 shows that, in contrast to the requirements throughout rush hours, larger SNR values are needed to provide acceptable BER effi-ciency during off-peak hours, regardless of whether the propagation path is LOS or NLOS. The mean distance among cars is smaller during rush hours than it is during late hours, which is the main cause of this disparity.
Table 3.
SNR settings required to achieve a BER of 10−6.
Time |
06:00 – 09:00 |
16:00 – 19:00 |
|||
Path |
LOS |
NLOS |
LOS |
NLOS |
|
SNR (dB) |
Lane 1 |
17 |
35 |
35 |
23 |
Lane 2 |
27 |
13 |
35 |
14 |
|
Table 3 presents a summary of the necessary SNR numbers at the transmitter in the V2V-VLC system during different situations in order to obtain a BER of 10−6. The following are the main findings from Table 3. In compari-son to rush hours, Table 3 shows that greater SNR levels are required to provide acceptable BER efficiency during off-peak hours. The main justification is that during rush hours, there is an average reduction in the space between vehicles. In other words, it is easier to maintain a depend-able V2V-VLC connection when traffic is at its worst and cars are positioned closer to one another. According to Table 3, it is possible to communicate throughout rush hours via the NLOS propagation path. This is a significant finding since it suggests that there may be a greater chance of blocking the LOS path within peak traffic hours. Because there are fewer other cars on NLOS lanes, commu-nication is more dependable.
The likelihood of blocking the LOS path is substantially lower in the evenings than in the mornings. This suggests that late at night, when traffic is lower, V2V-VLC communication with LOS is more dependable and available. Additionally, the data show that during rush hours communication via the NLOS method is feasible. This is an important finding because rush hours have a significantly higher blocking chance for LOS. However, the V2V-VLC system can still function using just NLOS communication. LOS communication is feasible and the blocking chance is lower during late hours. That means that V2V-VLC can be used during peak and off-peak hours. According to the above information, a simulation was carried out using the settings listed in Table 2 to assess the BER performance of a V2V-VLC link. The following are the main things to remember about this simulation: SNR and BER were the channel quality metrics used in the simulation.
Table 2 lists the parameters that were used in the simulation; these could include details about the VLC transmitters and receivers, as well as environmental factors that might have an impact on the channel quality. Evaluating the V2V-VLC link BER capacity was the main goal of the simulation. In communication systems, BER is an important parameter that measures how accurately data is transmitted. Reaching a low BER is necessary for dependable communication. The purpose of the simulation was to investigate the effects of changes in channel route loss at different times of the day. The typical technique for evaluating the system efficiency in VLC was to use the transmit SNR (SNR at the transmitter). SNR, a metric of the quality of the signal sent by the transmitter, is essential to assess the reliability of data delivery. The quality of the received signal can be affected by different channel impulse responses and the relationship between SNR and BER offers information about how well the system performs in these settings. The text makes reference to earlier research studies indicating that the simulation is consistent with the accepted industry standards and is a component of an ongoing VLC research project. In short, the model analysed the V2V-VLC link BER efficiency while taking the transmit SNR into account. The goal was to determine how variations in channel route loss under various circumstances affect the system ability to send information with excellent quality.
Conclusions
The paper examined how, during various periods of the day, varying traffic circumstances affect the efficiency of V2V-VLC systems on different lanes of two Malaysian highways. The study involved gathering information on traffic in order to evaluate the BER performance and compute average vehicle distances. The specific lane under consideration, as well as the traffic conditions had an impact on these vehicle distances. As a result, various lanes performance in BER were assessed while considering various traffic patterns and time periods. It was observed that, in comparison to the right paths, the leftmost lane consistently displayed the lowest BER during off-peak hours. The reason for this discrepancy is because the average left-lane V2V distance is 57.2 m, whereas the right-lane lengths are 109.8 m. In contrast, the right paths had lower BER values than the left lane throughout peak hours. This is explained by the fact that the right-hand lane has a far shorter average inter-vehicular distance – just 2.48 m – than the middle and left-hand paths which have mean distances of 7.79 m. Because of the significant difference in inter-vehicle distances between rush and off-peak hours, a much lower SNR is needed throughout rush hours to attain the same BER efficiency. For example, during rush hours, with a BER of 10−6, the SNR required for LOS connections in the right-hand lane is 13.7 dB, whereas during off-peak hours, it is 160.7 dB.
Furthermore, a statistical modelling technique was applied in the present investigation to characterise the likelihood of other cars being in adjacent lanes, as well as the effect of their reflections. According to the findings, there is a 90% chance of other cars using adjacent paths during rush hours, while throughout off-peak hours that chance drops to less than 10%. For a result, during rush hours, there is a much higher chance of reflections from nearby cars. The effectiveness of the NLOS elements affected by these reflections consequently becomes noteworthy and matches the LOS elements. As a result, during peak hours, achieving a BER around 10−6 requires decreased SNR levels (below 70 dB). Conversely, during off-peak hours, when the necessary SNR values to achieve BER = 10−6 surpass 100 dB, the importance of NLOS components decreases. The system effectiveness has been evaluated in every case based on the vehicle velocity-dependent metrics of SNR, BER, service coverage, and received data. The present research investigated the effects of changing traffic patterns on the performance of V2V-VLC systems on two separate paths of a Malaysian highway at various times of the day.
In order to calculate average inter-vehicular distances and assess BER efficiency, traffic measures were used in the study. Both the particular lane under study and the traffic patterns have an impact on these inter-vehicular distances. As a result, the BER performance was evaluated for several lanes throughout various times of the day and conditions of traffic. In comparison to the left and right paths, the left-hand lane was found to have the lowest BER during off-peak hours. This discrepancy results in the left-hand lane mean inter-vehicular distance of 57.2 meters, which is shorter than the right-hand lane and middle-hand lane respective distances of 67.1 and 109.8 meters. On the other hand, the right-hand lane had lower BER values than the middle and left-hand lanes during rush hours. This is explained by the fact that the middle and left-hand lanes have mean inter-vehicular distances of 3.93 and 7.79 m, respectively, whereas the right-hand lane mean length is lower at 2.48 m.
In order to achieve equal BER efficiency during rush hours, a significantly lower necessary SNR is needed than during off-peak hours due to the significant variance in inter-vehicle distances. For instance, for rush hours, BER at 10−6, the necessary SNR for LOS links in the right-hand lane is 13.7 dB, whereas during off-peak hours, it is 160.7 dB. In addition, the research used a statistical modelling methodology to describe the likelihood of other automobiles occupying nearby lanes and the impact of their reflections. According to the research, during rush hours, there is an 80% chance of other vehicles coexisting in adjacent lanes; however, during off-peak hours, this likelihood decreases to less than 20%. As a result, there is a much higher chance of reflections from nearby cars throughout the morning and afternoon crowds. Conse-quently, the performance of reflection-affected NLOS components becomes significant and matches that of LOS components. This means that lower SNR levels (less than 70 dB) are needed during rush hours to attain a BER of 10−6. During off-peak hours, however, the performance of NLOS components becomes negligible because SNR values above 100 dB are required to achieve BER = 10−6.
References
-
Chen, Z., Basnayaka, D. A. & Haas, H. Space division multiple access for optical attocell network using angle diversity transmitters.J. Light. Technol. 35, 2118–2131 (2017).https://doi.org/10.1109/jlt.2017.2670367
-
Alsalami, F. M. et al. Statistical channel modelling of dynamic vehicular visible light communication system. Veh. Commun. 29, 100339 (2021). https://doi.org/10.1016/j.vehcom.2021.100339
-
López-Cardona, J. D. et al. Power-Over-fibre in a 10 km long multicore fibre link within a 5G fronthaul scenario. Opt. Lett. 46, 5348–5348 (2021). https://doi.org/10.1364/ol.439105
-
Deng, X. et al. Two-dimensional power allocation for optical MIMO-OFDM systems over low-pass channels. IEEE Trans. Veh. Technol. 71, 7244–7257 (2022).https://doi.org/10.1109/tvt.2022.3162621
-
Algriree, W. et al. Validation hybrid filter detection for multi-user multiple input multiple output F-OFDM by universal software radio peripheral. Alex. Eng. J. 74, 241–268 (2023). https://doi.org/10.1016/j.aej.2023.04.033
-
Algriree, W. et al. An analysis of low complexity of 5G-MIMO communication system based CR using hybrid filter detection. Alex. Eng. J. 65, 627–648 (2023).
-
Algriree, W. et al. An analysis of 5G-MIMO communication system based SS for centralized cooperative and non-cooperative users. Egypt. Inform. J. 24, 161–172 (2023).https://doi.org/10.1016/j.eij.2023.02.003
-
Hosney, M., Selmy, H. A. I., Srivastava, A. & Elsayed, K. M. F. Interference mitigation using angular diversity receiver with efficient channel estimation in MIMO VLC. IEEE Access 8, 54060– 54073 (2020). https://doi.org/10.1109/access.2020.2981137
-
Jiao, Zh., Zhang, B. Liu, M. & Li, Ch. Visible light communication based indoor positioning techniques. IEEE Netw. 31, 12–18 2017, https://doi.org/10.1109/mnet.2017.1600264
-
Cheruvillil, P. A. & Kumar, D. S. Design and Analysis of Infrastructure to Vehicle Visible Light Communication Channel Modeling. in 27th International Conference on Advanced Computing and Communications (ADCOM 2022) 12–16 (IEEE, 2023). https://doi.org/10.1049/icp.2023.1449
-
Mohammadi, M., Sadough, S. M. S. & Ghassemlooy, Z. Enhanced secrecy outage probability for multiple‐input single‐output‐VLC systems through optical beamforming and improved light emitting diodes deployment. IET Optoelectron. (Print) 17, 101–109 (2023). https://doi.org/10.1049/ote2.12091
-
Rahman, M. T., Bakibillah, A. S. M., Parthiban, R. & Bakaul, M. Review of advanced techniques for multi‐gigabit visible light communication. IET Optoelectron. 14, 359–373 (2020). https://doi.org/10.1049/iet-opt.2019.0120
-
Msongaleli, D. L. & Kucuk, K. Optimal resource utilisation algorithm for visible light communication‐based vehicular ad‐hoc networks. IET Intell. Transp. Syst. 14, 65–72 (2019). https://doi.org/10.1049/iet-its.2019.0224
-
Mohanty, S. P., Choppali, U. & Kougianos, E. Everything you wanted to know about smart cities: The internet of things is the backbone. IEEE Consumer Electron. Mag. 5, 60–70 (2016). https://doi.org/10.1109/mce.2016.2556879
-
Bastos, A. R. N. et al. Flexible photoluminescent waveguide ampli- fiers to improve visible light communication platforms. IET Optoelectron. 14, 356–358 (2020).https://doi.org/10.1049/iet-opt.2020.0026
-
>Kahaei, M. H. & Nezamalhosseni, S. A.. Low complexity deep learning algorithms for compensating atmospheric turbulence in the free space optical communication system. IET Optoelectron. 16 , 93–105 (2020). https://doi.org/10.1049/ote2.12060
-
Vaiopoulos, N., Vavoulas, A. & Sandalidis, H. G. An assessment of a unmanned aerial vehicle‐based broadcast scenario assuming random terrestrial user locations. IET Optoelectron. 15, 121–130 (2021). https://doi.org/10.1049/ote2.12009
-
Căilean, A.-M., Dimian, M. & Popa, V. Noise-adaptive visible light communications receiver for automotive applications: a step toward self-awareness. Sensors 20, 3764 (2020). https://doi.org/10.3390/s20133764
-
Roy, R. & Saha, P. Headway distribution models of two-lane roads under mixed traffic conditions: A case study from India. Eur. Transp.Res. Rev. 10, 3–12 (2017). https://doi.org/10.1007/s12544-017-0276-2
-
Gongjun, Y. and Olariu, S. A probabilistic analysis of link duration in vehicular ad hoc networks. IEEE Trans. Intell. Transp. Syst. 12, 1227–1236 (2011). https://doi.org/10.1109/tits.2011.2156406
-
Abuella, H. et al. Hybrid RF/VLC systems: A comprehensive survey on network topologies, performance analyses, applications, and future directions. IEEE Access 9, 160402–160436 (2021). https://doi.org/10.1109/ACCESS.2021.3129154
-
Epple, B. Simplified channel model for simulation of free-space optical communications. J. Opt. Commun. Netw. 2, 293 (2010). https://doi.org/10.1364/jocn.2.000293.
-
Chen, C. et al. user-centric MIMO techniques for indoor visible light communication systems. IEEE Syst. J. 14, 3202–3213 (2020). https://doi.org/10.1109/jsyst.2019.2961696
-
Rahaim, M. & Little, T. D. C. Interference in IM/DD optical wireless communication networks. J. Opt. Commun. Netw. 9, D51– D51 (2017). https://doi.org/10.1364/jocn.9.000d51
-
Marshoud, H. et al. On the performance of visible light communication systems with non-orthogonal multiple access. IEEE Trans. Wirel. Commun. 16, 6350–6364 (2017). https://doi.org/10.1109/twc.2017.2722441
-
Butala, P. M., Elgala, H. & Little, T. D. C. Performance of Optical Spatial Modulation and Spatial Multiplexing with Imaging Receiver. 2014 IEEE Wireless Communications and Networking Conference (WCNC) 394–399 (IEEE, 2014).https://doi.org/10.1109/wcnc.2014.6952040
-
Cuiwei, H., Wang, T. & Armstrong, J. Performance Comparison between Spatial Multiplexing and Spatial Modulation in Indoor MIMO Visible Light Communication Systems. in 2016 IEEE International Conference on Communications (ICC) 1–6 (IEEE, 2016). https://doi.org/10.1109/icc.2016.7511379
-
Dobre R-A. & Vlădescu, M. Visible Light communi- cations: current challenges and prospects.” advanced topics in optoelectronics, microelectronics and nanotechnologies. Proc. SPIE 11718, 117182F (2020). https://doi.org/10.1117/12.2572074
-
Miramirkhani, F. & Uysal, M. Channel modeling and characteri- zation for visible light communications. IEEE Photon. J. 7, 1–16 (2017). https://doi.org/10.1109/jphot.2015.2504238
-
Yamazato, T. et al. The uplink visible light communication beacon system for universal traffic management. IEEE Access 5, 22282– 22290 (2017). https://doi.org/10.1109/access.2017.2759179
-
Lee, I. E., Sim, F. W. L. & Kung, F. W. L. Performance enhance- ment of outdoor visible-light communication system using selective combining receiver. IET Optoelectron. 3, 30–39 (2009). https://doi.org/10.1049/iet-opt:20070014
-
Islim, M. S. et al. The impact of solar irradiance on visible light communications. J. Light. Technol. 36, 2376–2386 (2018). https://doi.org/10.1109/jlt.2018.2813396
-
Chung, Y. H. & Oh, S. Efficient Optical Filtering for Outdoor Visible Light Communications in the Presence of Sunlight or Artificial Light. in 2013 International Symposium on Intelligent Signal Processing and Communication Systems 749–752 (IEEE, 2013). https://doi.org/10.1109/ispacs.2013.6704649
-
Cervinka, D., Ahmad, Z., Salih, O. & Rajbhandari, S. A Study of Yearly Sunlight Variance Effect on Vehicular Visible Light Communication for Emergency Service Vehicles. in 2020 12th International Symposium on Communication Systems, Networks and Digital Signal Processing (CSNDSP) 1–6 (IEEE, 2020). https://doi.org/10.1109/csndsp49049.2020.9249508
-
Khoder, R., Naja, R. & Tohme, S. Impact of Interference on visible light communication performance in a vehicular platoon. in 2020 International Wireless Communications and Mobile Computing (IWCMC) 1935–1939 (IEEE, 2020).https://doi.org/10.1109/iwcmc48107.2020.9148127
-
Algriree, W. et al. On the performance of various 5G signals sensing based on hybrid filter. international journal of wireless information networks. Int. J. Wirel. Inf. Netw. 30, 42–57 (2023). https://doi.org/10.1007/s10776-022-00589-0
-
Luo, P. et al. Performance analysis of a car-to-car visible light communication system. Appl. Opt. 54, 1696–1706 (2015). https://doi.org/10.1364/ao.54.001696
-
Algriree, W. et al. The impact of M-ary rates on various quadrature amplitude modulation detection.” Int. J. Power Electron. Drive Syst. 13, 483–483 (2023). https://doi.org/10.11591/ijece.v13i1.pp483-492
-
Chen, J. & Wang, Z. Topology control in hybrid VLC/RF vehicular ad-hoc network. IEEE Trans. Wirel. Commun. 19, 1965–1976 (2020). https://doi.org/10.1109/twc.2019.2960229
-
Algriree, W. et al. A CR-5G network based on multi-user for various waveforms detection. Egypt. Inform. J. 23, 517–527 (2022). https://doi.org/10.1016/j.eij.2022.05.004
-
Ahmad, Z., Haas, O. &Rajbhandari, S. Regular- Shaped Geometry-Based Stochastic Model for Vehicle-To-Vehicle Visible Light Communication Channel. in 2019 IEEE Jordan International Joint Conference on Electrical Engineering and Information Technology (JEEIT) , 297–301 (IEEE, 2019) https://doi.org/10.1109/jeeit.2019.8717408
-
Nishimoto, S. et al. Overlay Coding for Road-To-Vehicle Visible Light Communication Using LED Array and High-Speed Camera. in 2011 14th International IEEE Conference on Intelligent Transportation Systems (ITSC), 1704–1709 (IEEE, 2011). https://doi.org/10.1109/itsc.2011.6082943
-
Dimian, M., Popa, V., Chassagne, L. & Cagneau, B. Novel DSP receiver architecture for multi-channel visible light communications in automotive applications. IEEE Sensors J. 16, 3597–3602 (2016). https://doi.org/10.1109/jsen.2016.2529654
-
Cahyadi, W. A. & Chung, Y. H. experimental demonstration of VLC-based vehicle-to-vehicle communications under fog conditions. IEEE Photon. J. 7, 1–9 (2015). https://doi.org/10.1109/jphot.2015.2499542
-
Lian, J. & Brandt-Pearce, M. Multiuser MIMO indoor visible light communication system using spatial multiplexing. J. Light. Technol. 35, 5024–5033 (2017). https://doi.org/10.1109/jlt.2017.2765462